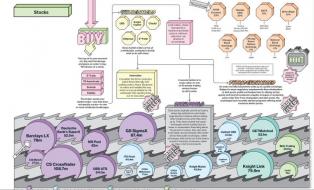
User: House of Cards: Trading
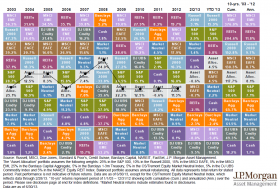
Table
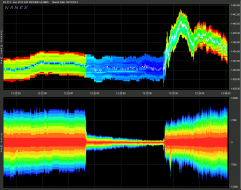
What a pretty chart, so colorful. It may explain why I tend to lose in this market: I'm a "winter" and my colors...

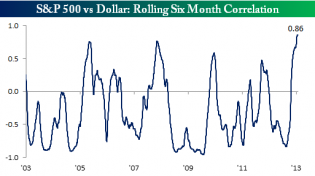
Correlation1
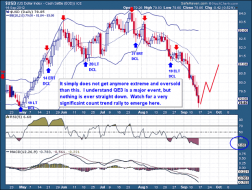
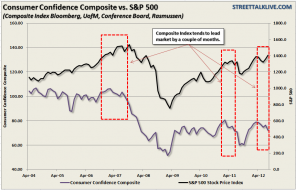
Dollar vs S&P hits extreme
BLB37fcCUAA6v_l.png 1,011×581 pixels
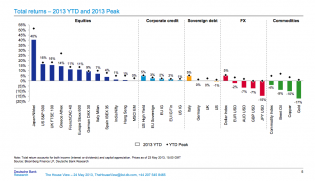
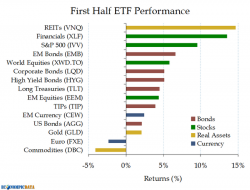
The winners and losers
1
Clive Maund
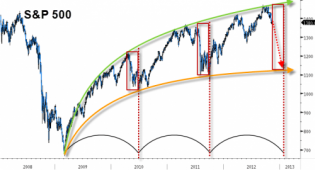
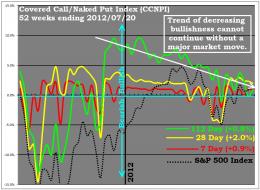
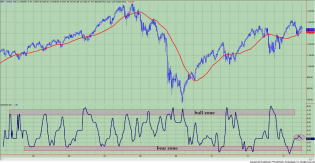
Ahhh, here's the chart for the bears (breaks into song: "Somewhere, over the rainbow..."
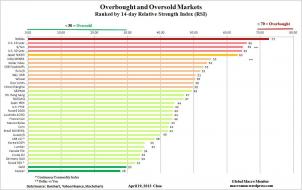
WIR_Overbought
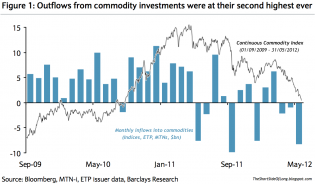
Time to buy gold, sell gas?
Chart
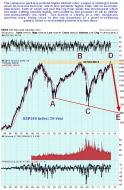
Never giving up hope, we still look for a way out of this bullish nightmare. Still have to make it through April,...
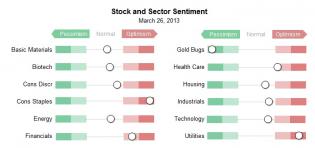
sector sentiment
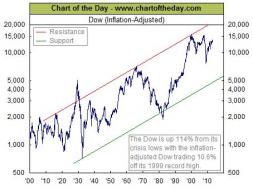
chart-of-the-day-feb.jpg 454×340 pixels
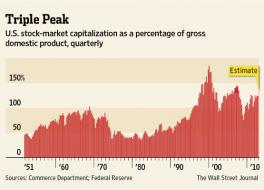
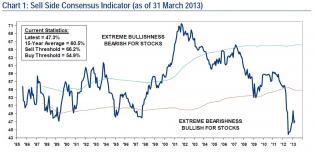
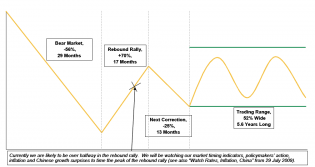
triple-peak.jpg 555×398 pixels
Hussman Funds - Weekly Market Comment: Capitulation Everywhere -...
Hussman Funds - Weekly Market Comment: Capitulation Everywhere -...
3
Chart
20130123
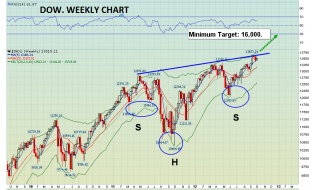
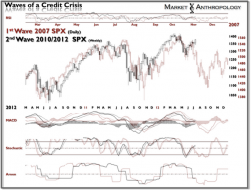
This does not look like a bear's favorite chart.
secular-bear-markets.png 1,008×537 pixels
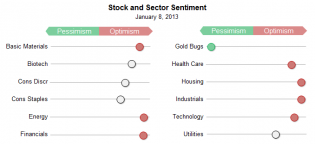
sector sentiment
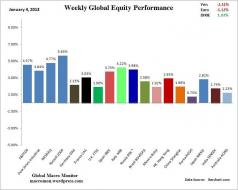
WIR_Equity_Week
chart
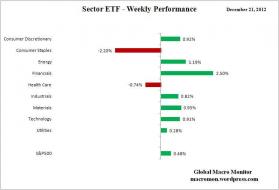
ETF_Week
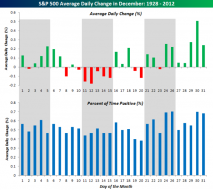
santa-on-his-way.png 700×623 pixels
Chart
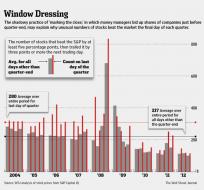
window-dressing1.jpg 555×515 pixels
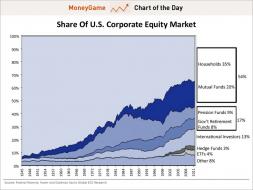
chart of the day, who owns the stock market, november 2012

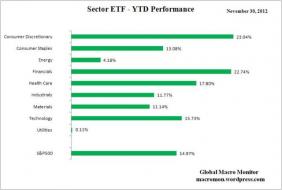
ETF_YTD
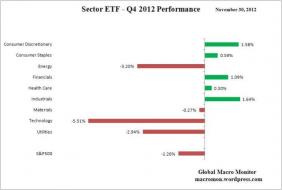
ETF_Q4
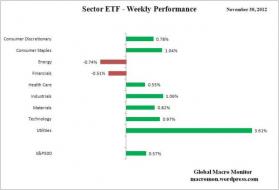
ETF_Week
card3416
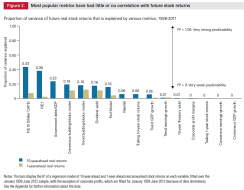
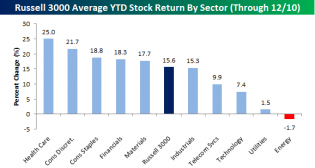
stock return metrics
Click to View
The Strange (and Worrisome) Symmetry Of Bernanke's Bull Market |...
1
321gold.com/editorials/sfs.../usd_sell.gif
chart
gracelandupdates.com/image...2oct2dow2.png
US Dollar Index
chart
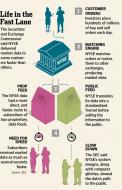
HFT freak out
The Price of QET: "QE Topless" (aka QE3)
P1-BI126_NYSESE_G_20120914180609
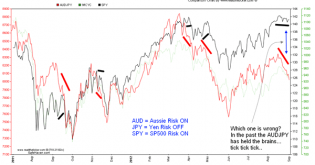
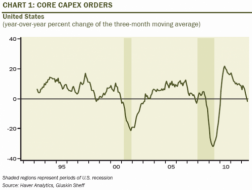
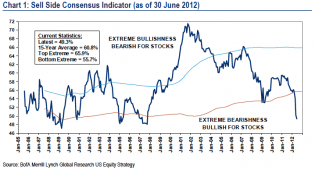
Chart 1
SPY versus Transports
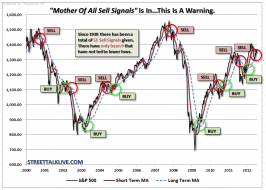
20120725_sell.png

5
Short Side Of Long
QE3 Mechanism Is Broken
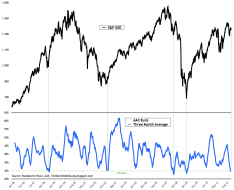
chart
3 month moving average dips its toe in the water
chart
chart
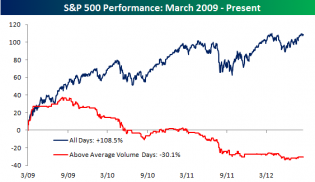
volumespy
2
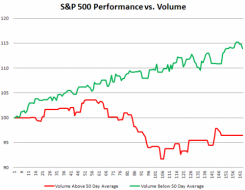
Why Volume Matters - The UnBearable Lightness Of Bear Market Ral...
2012-08-17_1106 - BDI's library

Tltspy
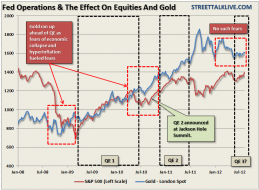
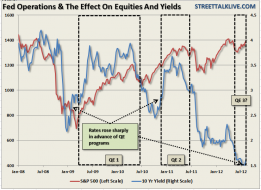
Gold, Dollar & Rates Say No QE
2
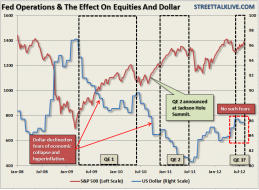
Gold, Dollar & Rates Say No QE
Gold, Dollar & Rates Say No QE
Click to View
Options Show Market Ready To Shift Gears | zentrader.ca
Market Anthropology: the Game
useful analog?
2
Current Market Snapshot
homebuilders get excited so the market gets excited?
Click to View
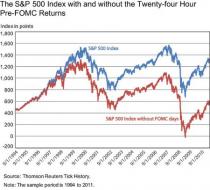
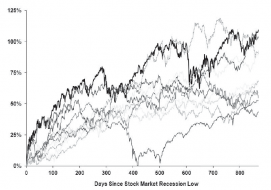
Sp-with-and-without
1
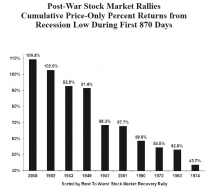
Returns-on-sp-500
Short Side Of Long
Short Side Of Long
Short Side Of Long
Short Side Of Long

Short Side Of Long
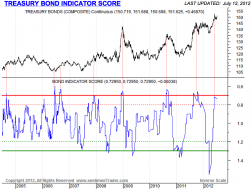
Time to short bonds?
Short Side Of Long
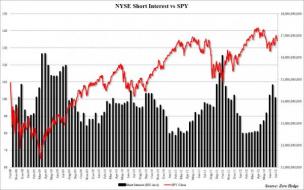
NYSE Short Interest Plunges By Most Since January, As Equity Out...

The Oil Drum | Ruthless Extrapolation
Trends stay the same until they change.
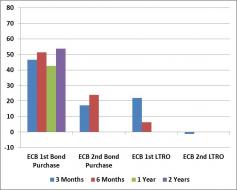
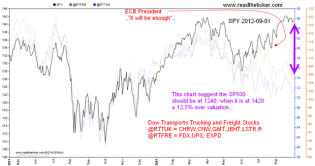
ecb effects.jpg
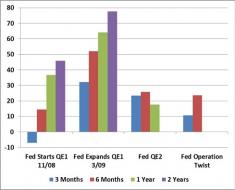
qe effects.jpg
qe becoming less and less effective
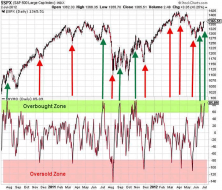
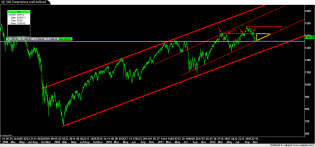
$SPX (S&P 500 Large Cap Index) INDX
1
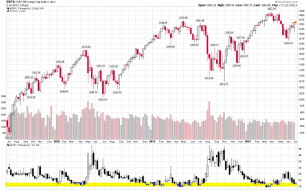
VIX and More
Vix at 15 = market top?
Screen Shot 2012-07-02 at 6.58.39 PM
2
Screen Shot 2012-07-02 at 7.46.42 PM
s&p
2
Click to View
EconomPic
Nightmare on Wall Street
bear markets
Nightmare on Wall Street
bull markets
Click to View
was 2009 the bottom of this secular bear?
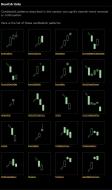
blue chip bull dog: Jack Jumped Over The Candlestick!

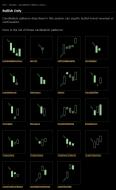
blue chip bull dog: Jack Jumped Over The Candlestick!

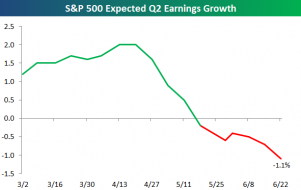
Bespoke Investment Group - Think BIG - S&P 500 Q2 Earnings Growt...
Is 1450 on the S&P really in the cards?
When Will Reality Intrude? | Peak Prosperity
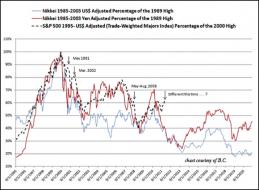
Nikkei/s&p tracks
1
rosenberg volatility chart

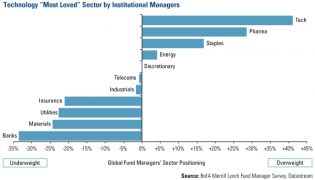
Technology 'Most Loved' Sector by Institutional Managers
Institutional managers currently love tech, hate commodities, banks