Log In
|
Create Account
Chart
AI Chart Analysis
Chart Lab
Drawn Objects ➟
Earnings Reactions
Guide to Patterns ➟
Modes ➟
Power Features ➟
Rotation Graphs
SlopeCharts
Yield Curve
Equities
Biggest Stocks
Calendar of Earnings
Correlations
Earnings ➟
Historical Earnings
Market Capitalization
Power Screener
Super Summary
Volume/Price Leaders
Woulda Shoulda
Markets
CryptoStream LIVE
Economic Database
Global Economics
Heatmap
Macroeconomics
Market Meter
MetaSymbols
Quad Matrix
SlopeRules
Watch Lists
Options
Analytics ➟
Backtest Strategies
Earnings Calendar
Extreme Options
Historical Charts
Matrix of Volatility
Open Interest & Volume
Payoff Analyzer
Strategy Explorer
Volatility Calendar
Read
Automatic Reports
Best Posts of All Time
Books by Tim Knight
Guide to Comments
Latest Posts
Mobile Apps
Profile of Your Host
Recommended Books
Ticker Stripper
Trading Rules
Social
Browse Chart Database
Comments Search
Hall of Fame
Members Directory
Publishing/Subscribing
Recent Activity
Search SlopeRules
Shared Labels & Lists
SlopeTalk LIVE
Trader’s Diary
Help
Best Pages for You
Charts Overview
Guide to the Site
Membership Levels
Pattern Video Library
Power Screener Guide
Premium Memberships
SlopeCharts Reference
SlopeCharts Videos
Video Tutorial
Log In
Create Free Account
Memberships
User:
HeadsUWin_TailsILose
:
SPY
: dowMonthly_01112014.png
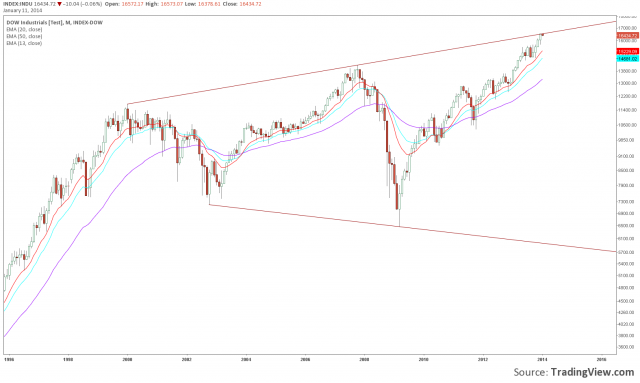
dowMonthly_01112014.png
Seems the DOW monthly expanding wedge is holding for now.
See Full Size
Comments
Dink
It's weird how different data providers give different looks for this DOW chart. On others, even on log or semi log charts, it looks like price has already broken above the top wedge. Guess it hasn't yet.
1/11/14
Mike1981
Patience.
1/11/14
...
Actions
Tweet
Facebook
Stacks
DOW
SPY
Posted
By:
HeadsUWin_TailsILose
On:
1/11/14 8:03AM
Statistics
Viewed by 20 SocialTraders
Average rating based on 3 responses:
Rated By
 Dink
Dink


