Browse Symbol Stacks: $AAPL
s3.amazonaws.com/cdn2.soci..._gIl0l5_l.png
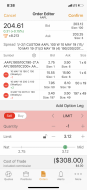
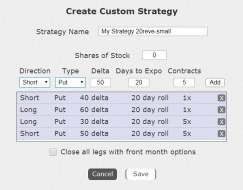
Short hedge + ratio spread, near minimal loss with increase in value with volatility

3
Hedged bull.png
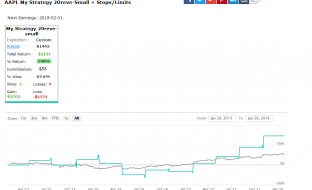
The hedged bull. (AAPL earnings)
1
AAPL earnings strat options.png
Enter tomorrow (ATM nearest expiry call option c $170 strike). Close 1 d after earnings (2/1)
1
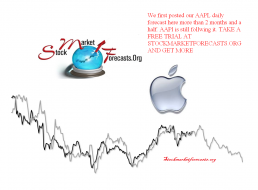
AAPLDailyForecast.PNG

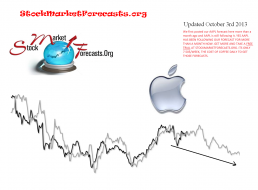
AAPL.PNG
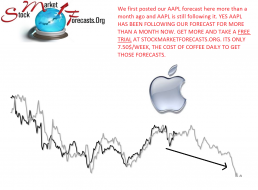
AAPL.png
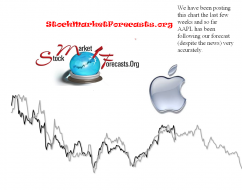
AAPLDailyForecast1.PNG

AAPLDailyForecast.PNG
1
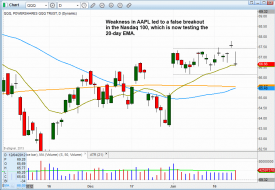
Technical pattern of stock - $NASDAQ 100
Brief article on my blog that shares my simple and objective technical view on where the major indices may be expe...

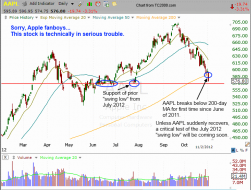
$AAPL breaks below its 200-day moving average
Why is the Nasdaq displaying such relative weakness? Blame it in no small part on the persistent bearishness and d...