Browse Symbol Stacks: $BRENT
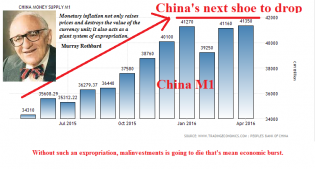
m1_china.png
I guess China's money supply growth rate has been significant driver of commodity demand recent months. Looks like...

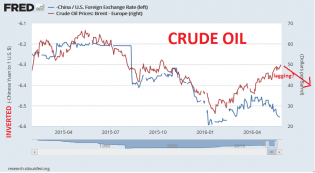
CRUDEOIL_YUAN.png
There is correlation between CNYUSD and Crude Oil. As I said in previous post CNYUSD correlate with Treasury Accou...
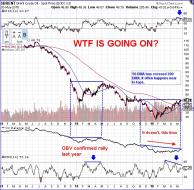
BRENT.jpg
very suspicious rally
1
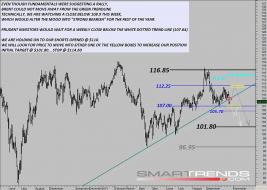
BRENT_24_10_2013.jpg
Throughout 2013, Brent Oil has been "rebounding", but not "trending". We will be shorting the market, with the fol...

1