Browse Symbol Stacks: CMI
slopechart_CMI.jpg
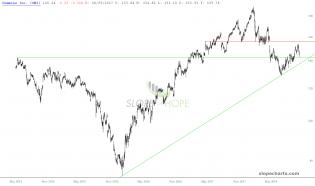
CMI breaking h.

slopechart_CMI.jpg
I'm betting CMI is due to fall.
The green trendline from 2003 was an important measure to break. Divergence on CCI.
2
slopechart_CMI.jpg
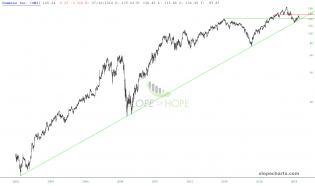
Big Industrial

slopechart_CMI.jpg
CMI - Closer view. I need to wait, I think. But each of last three highs have been closer to the major trend...f...

2
slopechart_CMI.jpg
CMI - I feel like this company/group is heading down, not up. But still on wrong side of the long term trend line...