Browse Symbol Stacks: COST
slopechart_COST.jpg
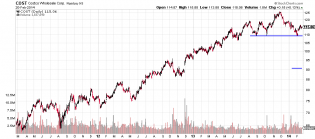
$COST at BRN and earnings.

slopechart_COST,WMT,PG,XLP.jpg
spot the outlier

2
slopechart_COST.jpg
Jeez, Costco
slopechart_COST.jpg
slopechart_COST.jpg
I was going to buy COST when it got above 600 but I didn't like the big gap up that day. Moron.
slopechart_COST.jpg
COST - Flying to all time highs...with negative divergence since the beginning of 2024.

1
slopechart_COST.jpg
Is Costco a tech stock?
1
slopechart_COST.jpg
Left this channel on the chart since November
slopechart_COST.jpg
Been a while -- I wish I was feeling that I could take this trade - but my portfolio is beat up at the moment. Bu...
1
slopechart_COST.jpg
Costco - serving up growth ins 1986. So far this year creating a hammer candle. Amazing Chart.
fredgraph.png (700×718)

6
slopechart_AAL.jpg

slopechart_COST.jpg
slopechart_COST.jpg
A solid company that is a long tern buy and hold.

slopechart_COST.jpg
If it goes lower then BTFD
slopechart_COST.jpg
Great retail stock
slopechart_COST.jpg
Diamond breakout.

slopechart_COST.jpg
Big ol' diamond on COST daily, before earnings
slopechart_COST.jpg
Announced Monster same store sales and comparable sales after hours,
Cycle.gif

slopechart_COST.jpg
Pull back to the 5 ema
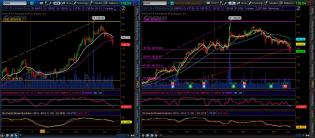
COST_Weekly_vs_Daily_June092015.jpg
Optionable trade possibility for America's favorite big box chain, CostCo.
The close beneath 34-week EMA last w...

cost.png
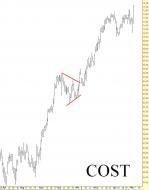
COST head shoulders top

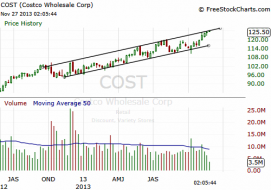
The Market Zone | $COST touched the upper trend line of a weekly...
$COST testing a weekly trading channel. Yesterday's candle ended as a Pinbar after touching the channel

PN-1.JPG