Log In
|
Create Account
Chart
Chart Lab
Drawn Objects ➟
Earnings Reactions
Guide to Patterns ➟
Modes ➟
Power Features ➟
Rotation Graphs
SlopeCharts
Videos for SlopeCharts
Yield Curve
Equities
Biggest Stocks
Calendar of Earnings
Correlations
Earnings ➟
Historical Earnings
Market Capitalization
Power Screener
Super Summary
Volume/Price Leaders
Woulda Shoulda
Markets
Automatic Reports
Commodities
CryptoStream LIVE
Economic Database
Global Economics
Macroeconomics
Market Meter
MetaSymbols
Quad Matrix
SlopeRules
Options
Analytics ➟
Backtest Strategies
Earnings Calendar
Extreme Options
Historical Charts
Matrix of Volatility
Open Interest & Volume
Payoff Analyzer
Strategy Explorer
Volatility Calendar
Read
Best Posts of All Time
Books by Tim Knight
Comments Search
Guide to Comments
Latest Posts
Mobile Apps
Profile of Your Host
Recommended Books
Ticker Stripper
Trading Rules
Social
Activity Feed
Browse Chart Database
Hall of Fame
Members Directory
Publishing/Subscribing
Recent Activity
Search SlopeRules
Shared Labels & Lists
SlopeTalk LIVE
Trader’s Diary
Help
Best Pages for You
Charts Overview
Guide to the Site
Membership Levels
Pattern Video Library
Power Screener Guide
Premium Memberships
SlopeCharts Reference
Using SlopeTalk Chat
Video Tutorial
Log In
Create Free Account
Memberships
Browse
Symbol Stacks
: DFS
slopechart_DFS.jpg
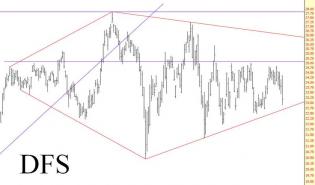
DFS - interesting to note the Cloud levels in relation to trendlines. Earnings today.
1
slopechart_DFS.jpg
Looks like it's time for DFS to give it up, again.
2
slopechart_DFS.jpg
DFS - Early in the day, so anything can yet happen. If it closes like this, what does a double bearish harami imply?
3
slopechart_DFS.jpg
DFS putting up a fight. Holding above 2007 uptrend line which it tagged. Holding under 112 is key to the downside.
2
slopechart_DFS.jpg
D-Day for DFS. Trendlines from 2007 and 2009.
1
1215-DFS
This turned out to be a very nice continuation pattern