Browse Symbol Stacks: DOLLAR: Weekly US dollar log.png
Weekly US dollar log.png
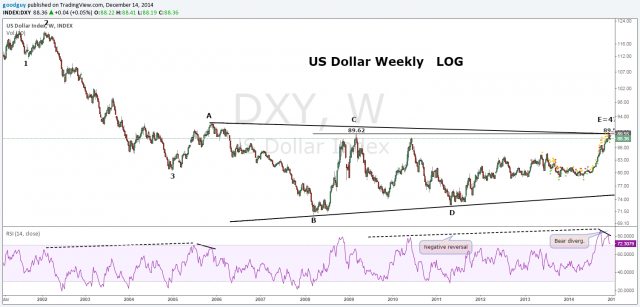
I still think there is a good chance the US dollar has been forming a long term 5 wave triangle (ABCDE) before one last major drop. Although the RSI has gone to a new high, the price high at C has not yet been bettered leading to a potential negative reversal. This pattern indicates that price is weaker than the indicator and often leads to new lows. We also have a bear divergence more recently in the RSI where the RSI has been dropping while the price is rising. This week we also has a weekly bearish engulfing candle. When all added together it looks potentially very bearish. Good trading to you. Tom B
Comments
 Skipperleejones
