Log In
|
Create Account
Chart
Chart Lab
Drawn Objects ➟
Earnings Reactions
Guide to Patterns ➟
Modes ➟
Power Features ➟
Rotation Graphs
SlopeCharts
Videos for SlopeCharts
Yield Curve
Equities
Biggest Stocks
Calendar of Earnings
Correlations
Earnings ➟
Historical Earnings
Market Capitalization
Power Screener
Super Summary
Volume/Price Leaders
Woulda Shoulda
Markets
Automatic Reports
Commodities
CryptoStream LIVE
Economic Database
Global Economics
Macroeconomics
Market Meter
MetaSymbols
Quad Matrix
SlopeRules
Options
Analytics ➟
Backtest Strategies
Earnings Calendar
Extreme Options
Historical Charts
Matrix of Volatility
Open Interest & Volume
Payoff Analyzer
Strategy Explorer
Volatility Calendar
Read
Best Posts of All Time
Books by Tim Knight
Comments Search
Guide to Comments
Latest Posts
Mobile Apps
Profile of Your Host
Recommended Books
Ticker Stripper
Trading Rules
Social
Activity Feed
Browse Chart Database
Hall of Fame
Members Directory
Publishing/Subscribing
Recent Activity
Search SlopeRules
Shared Labels & Lists
SlopeTalk LIVE
Trader’s Diary
Help
Best Pages for You
Charts Overview
Guide to the Site
Membership Levels
Pattern Video Library
Power Screener Guide
Premium Memberships
SlopeCharts Reference
Using SlopeTalk Chat
Video Tutorial
Log In
Create Free Account
Memberships
Browse
Symbol Stacks
: ERY
slopechart_ERY.jpg
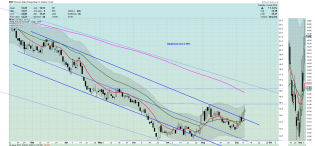
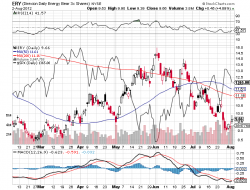
ERY - Second mouse gets the cheese trade.
2
slopechart_ERY.jpg
ERY looking to fill open gap with good risk/reward off potential bottom here.
slopechart_ERY.jpg
A bullish trade on the inverse Energy. Sometimes easier to see where something is headed on a familiar chart.
1 new message
Energy Sector Setting Up For Another Big Trade – Technical Trader...
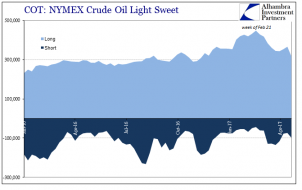
ABOOK-May-2017-Oil-WTI-COT-Long-Short-Recent.png
So much oil pain still remains if the longs ever start selling in size http://www.alhambrapartners.com/2017/05/04/...
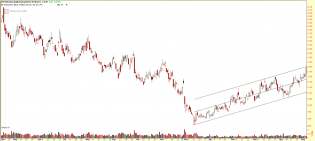
ERY Long Exit_May 4th.PNG
I exited this position today based on this channel and feel great about it. For those still holding, I hope I reg...
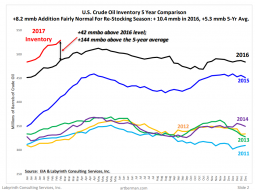
201703oilinventory.png
Oil inventory higher than in 2016.
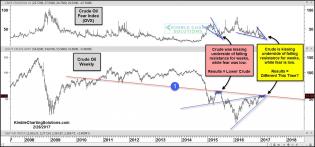
crude-oil-kissing-underside-of-resistance-for-weeks-with-crude-feal...
Kiss of death
3
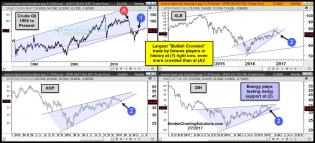
crude-oil-testing-resistance-as-most-bullish-crowded-trade-in-histo...
Crude oil - most crowded bull trade in history
2
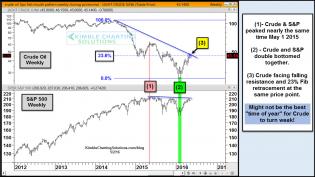
crude-oil-spx-facing-falling-resistance-first-of-may-may-2.jpg (...
Sell in May for crude oil
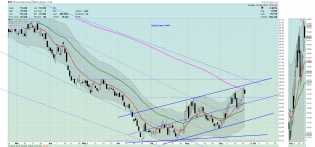
ERY.png
ERY is something I brought to everyone's attention a few weeks ago and it continues to look strong, albeit speculativ...
ERY.png
This is speculative because all moving averages are below the MA(144) line, however it's sister ETF ERX broke down...
sc.png
As you can see, a reading above 80 on the McClellan Oscillator has marked interim tops pretty reliably. It triggered in July 2011 just before the August crash, in late August 2011 before the sharp move lower in September 2011 (especially...
Flipping Short