Browse Symbol Stacks: F
slopechart_F,U,C,K.jpg
there, you've said it

slopechart_F.jpg
Blockhead
slopechart_F.jpg
FUGLY
2
slopechart_F.jpg
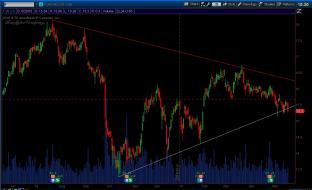
F - loss of support with the gap down today.
Huge short interest.
Last week [or two ago] they said they were una...

2
slopechart_F.jpg
I am long F - great "American" products. If this range can hold up into January look for explosive move higher fo...

3
slopechart_F.jpg
Gap resistance held so far.

slopechart_F.jpg
The highlighted peak in Ford was May 4, 1999. 55 years earlier - in 1944, "Gaslight", starring an 18-year-old Ang...

slopechart_F.jpg
You people are in rare form this Morning.
Just Do IT!
Just Go Further @Claws
'merica THE GREAT! buy Gold @...

3
slopechart_F.jpg
Strikes at British airlines, auto manufactures, economy tanking. Perhaps it's the Feds fault. No, probably their d...
3
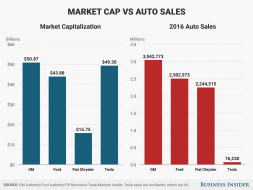
Tesla Detroit sales vs market cap

1
Ford_DailyUpdate_May202015.jpg
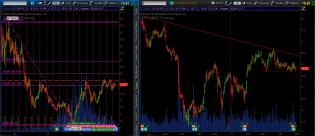
Updating my post on Ford from May first -http://slopeofhope.com/socialtrade/dynamic/file/full/18355
The bearish...

4
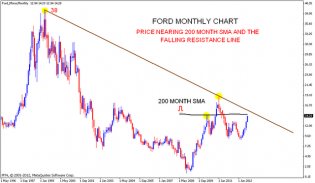
Ford_Monthly_Daily_May012015.jpg
Poor auto sales numbers today put Ford on bear watch.
Monthly chart shows Ford failing to hold trade above $17....
1
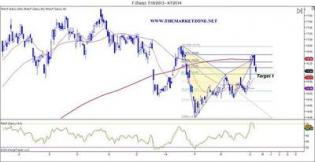
Ford (F) bearish harmonic trading pattern, reached... - The Mark...
Successful harmonic trading pattern in Ford

StockTwits® - Share Ideas & Learn from Passionate Investors & Traders
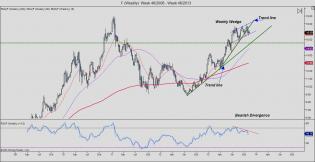
$F weekly chart analysis - Wedge pattern on the weekly charts suggests 2 trading scenarios
FORD Motor Chart update | Nifty charts and latest market updates
Ford motor chart analysis

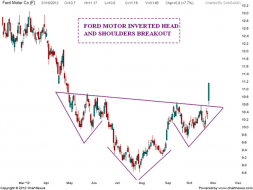
FORD Motor Inverted Head and shoulders | Nifty charts and latest...
Ford Chart analysis
cdn.socialtrade.com/comsys..._uYwzJa_m.jpg
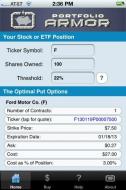
A potential bullish indicator for F: relatively low optimal hedging cost.
