Browse Symbol Stacks: FCE
11 aug31.png


5 may3.PNG
1 may1.PNG
3 apr25.PNG
2 apr25.PNG
5 apr23.PNG
2 oct29.PNG
https://www.youtube.com/watch?v=0ofr9o_WjM8
4
4 aug29.png
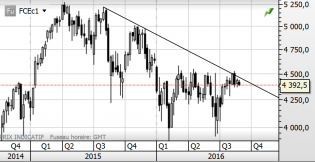
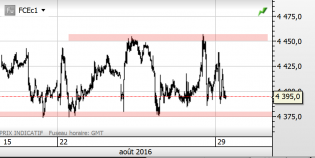
Back below daily resistance
3 aug29.png
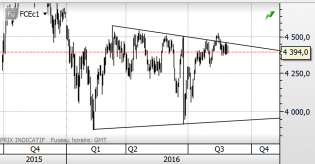
Back below weekly resistance
2 aug29.png
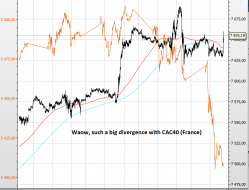
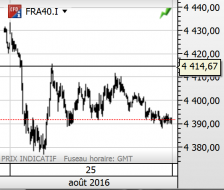
CAC40 total chaos!
2
6 aug25.PNG
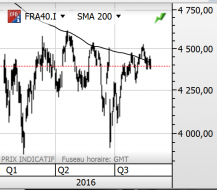
and here is 200dma on a big picture...
5 aug25.PNG
Cac40 broke 200dma at the open then retested it nicely then failed to retest a second time
SEE NEXT POST
4 aug16.png
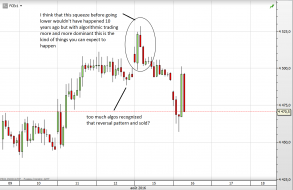
cac40 index
6 aug12.PNG
My guess on cac40
4 aug12.PNG
CAC40 index
3