Browse Symbol Stacks: GE
slopechart_GE.jpg
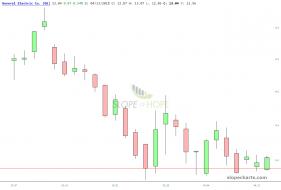
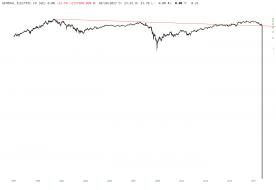
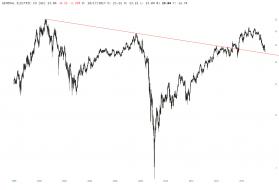
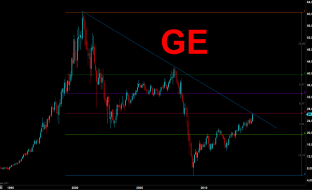
Beaut of a top on GE.

4
slopechart_GE.jpg
GE - What I said two days ago when GE popped up on earnings: IF price cannot stay above new-found support, and st...
1
slopechart_GE.jpg
MMM earnings reaction was a pop-up. Price decisively jumped out of the channel, over resistance, with volume.
Cr...
2
slopechart_GE.jpg
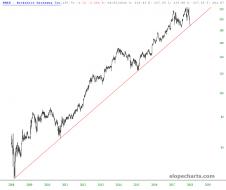
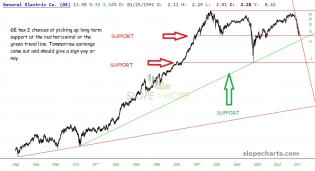
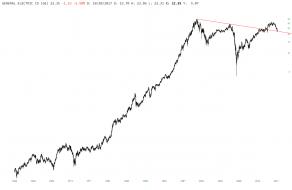
GE - Does it have the oomph to hurdle the downtrend resistance from the 2000 top, prior to the end of the year?
4
slopechart_GE.jpg
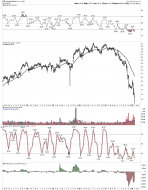
breakdown

slopechart_GE.jpg
GE
3
slopechart_GE.jpg
Lots of short interest in GE.
1
slopechart_GE.jpg
Gee...GE.
1
slopechart_GE.jpg
Solid break below lower purple looks like a good shorting op on GE.
3
slopechart_GE.jpg
We Bring Good Things to Light - That is until the competition breaks us.

slopechart_GE.jpg
Things not looking too good for GE
slopechart_GE.jpg
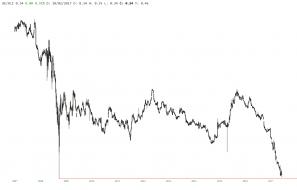
Continues to fall from grace which was lost over half a decade ago

slopechart_GE.jpg
My view

1
slopechart_BRKB.jpg

slopechart_GE_41918.jpg
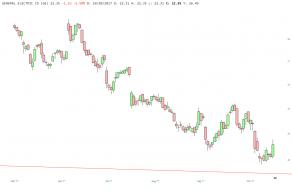
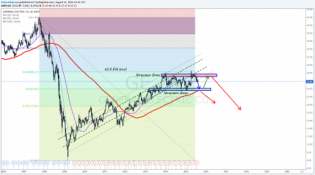
GE closing in on support. Earnings tommorrow will likely indicate whether they hold.

1
slopechart_GE.jpg
The support line is a horizontal drawn from the 2003 low.

sc-1158.png (990×1270)

slopechart_GE_XLI.jpg
GE still hasn't stopped falling relative to Industrials SPDR (XLI)
slopechart_GE (2).jpg
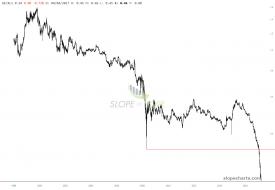
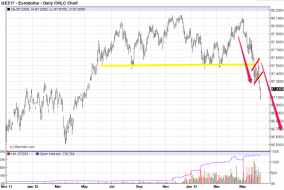
Close up on GE breaking below long-term resistance line between 2000 and 2007 tops.
slopechart_GE (3).jpg
GE done broke it.
slopechart_GE (1).jpg
Slope Charts is getting cocky.
slopechart_GE.jpg
GE, we bring bears back to life.
slopechart_GE-XLI.jpg
Ratio of GE to industrial ETF (XLI). Approaching 2008 low.
GE - Weekly - 8.18.16.png
GE - weekly chart. This is not investment advice.

1
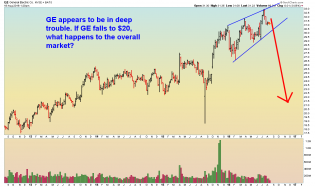
Broke below ascending channel - 24$ will be tested... • The Ma...
Long term analysis on GE suggests it is heading lower

GE.png

marcfargas.es: ¿Eurodollar a 95.500?
95.500 is coming!

1
market-cap-percent-spx1.png (555×474)
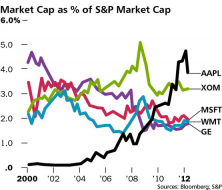
5 Biggest Market Caps As % of S&P500
1
2012-12-19-TOS_CHARTS.png

gagaindicatorbreakingsupportnov7.gif (1558×692)
The GAGA indicator
1
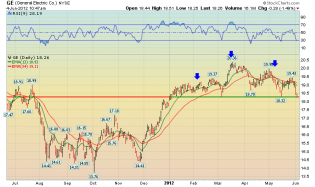
Stock picks with support & resistance charts : GE, EIX & HRB
Stock Picks – GE, EIX, HRB
Stock picks with support & resistance charts : GE, EIX & HRB


anImage

Screen Shot 2012-06-04 at 9.47.43 AM.png
GE H&S