Browse Symbol Stacks: HYG
slopechart_HYG.jpg
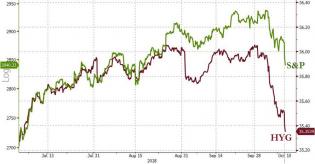
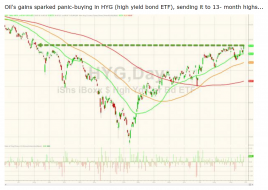
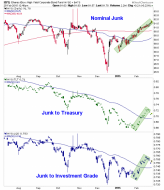
no fear - junk flying

slopechart_HYG.jpg
no signs of issues in junk bonds
slopechart_HYG.jpg
Junk fading
slopechart_HYG.jpg
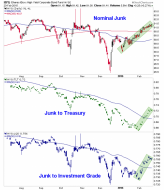
Junk dipping
1
slopechart_HYG.jpg
Junk still elevated
slopechart_HYG.jpg
mind the canary
slopechart_HYG.jpg
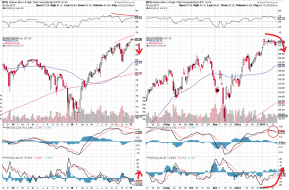
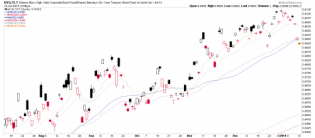
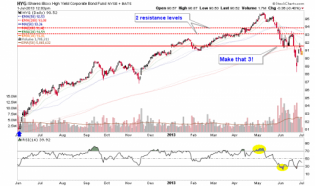
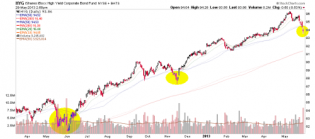
Junk bonds, support turned into resistance
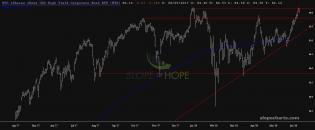
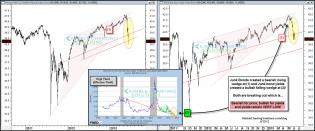
credit market predictor.png
Inverse of IEI/HYG ratio, estimated prediction of market direction, and Bollinger Band (Volatility) limits

slopechart_HYG.jpg
Long way down
2022-04-21_11-34-57.jpg (500×326)

slopechart_HYG.jpg
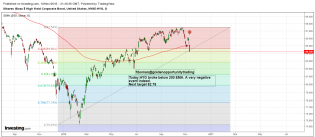
Roadmap of HYG courtesy of KGS.
Weekly chart.

3
high yield credit spreads
Rising credit spreads not positive for economy (Captain Obvious).

slopechart_HYG.jpg
Junk!
credit spreads
Credit spreads still tame, which is not bearish.
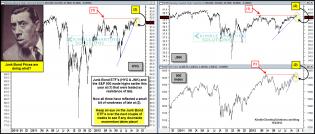
Say, do you think risk is still ‘on’? | Notes From the Rabbit Hole
Message from junk bond land... risk still 'on' as of now.
The Fed is not directing the markets, but indicators like this a...
The Fed is not directing markets, but the 2yr yield and indicators like this (credit spreads) most assuredly are...
slopechart_HYG.jpg
Many looking to fill last week's gap

slopechart_HYG.jpg
Get back to they buy button Jerome!
slopechart_HYG.jpg
The Powell Pump
slopechart_HYG.jpg
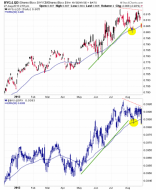
Needs to resume uptrend for the market to follow through
slopechart_HYG.jpg
HYG.
Fed farces to consider, but the chart dictates lower prices.
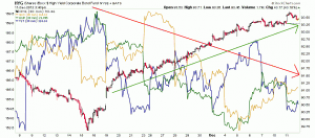
Beaut of a trendline:
Turquoise is from the...
slopechart_HYG.jpg
A key to market direction
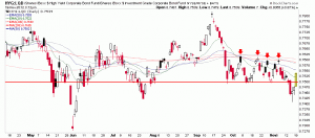
slopechart_HYG.jpg
The pullback sets up an appointment with the 50EMA
slopechart_HYG.jpg
Your Government money at work
1
slopechart_HYG.jpg
slopechart_HYG.jpg
Fed helping the market. To hell with the American people.
bfm361.jpg (976×508)
1
slopechart_HYG.jpg
High yield, euphemism for junk.
2
slopechart_HYG.jpg
The Equity Indicator
1 feb5.PNG

2 Bearish Indicators – Notes From the Rabbit Hole
Bearish indicator #2 (among many).
Monthly Macro Monitor – November 2018 – No robo-content, no...
Credit spreads - while still very low - break out of bottoming range.
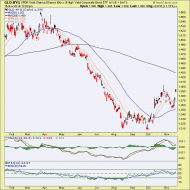
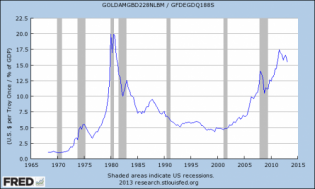
gld.hyg
Gold vs. Junk bonds is on its way to a counter-cyclical condition.
2018-10-10_9-10-22_0.jpg (890×466)
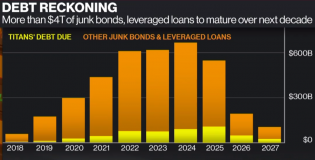
ajatCiR.png (1115×567)
Debt Reckoning: More than 4T of junk bonds to mature over next decade.

slopechart_HYG.jpg
Risk on rally in junk for June! HYG currently pays a 30 day yield of 5.76% on fund holdings rated BB grade and und...
2
3 june15.PNG
8 june13.PNG
2
6 may3.PNG
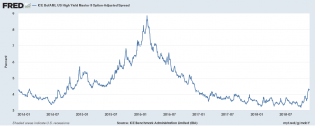
slopechart_FR_BAMLH0A0HYM2 (1).jpg
BofAML US High Yield Master II Option-Adjusted Spread failed to drop despite yesterday's monster rally.

20171215_HY3.jpg (1019×1080)
This is "unusual... Must Watch"
1
20171115_EOD8.jpg (959×1008)
A beautiful analog...........
1
5 nov5.PNG
SlopeChart_HYG_2017.09.07.jpg
HYG - on the way to $80.50 area...

1
1 may26.PNG
Top candidate on EEM
9 jan22.PNG
Beware yield seekers!
Seems to me as a good candidate for a reversal
2
hyg 10.11.16.png
hyg below ema200

tvc_714f866586aa2a142fd2aac161dbc49e.png
junk bonds correction?
13 sept28.PNG
There is no market anymore only correlations/decorrelations and arbitrage between asset classes. Algos driven deci...
9 sept8.PNG
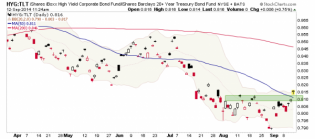
HYG (not total return performance) and crude oil and their 100 day correlation
Who's right this time?
1
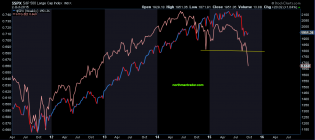
HYG 27.06.16.png
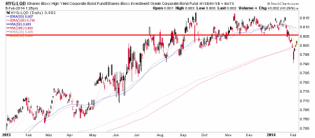
Today we saw a nasty break down for High yield Bonds(HYG) signaling further weakness initially towards 78.5-80.Eq...
1
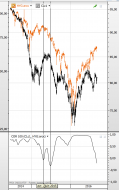
20151207_EOD6.jpg (958×471)
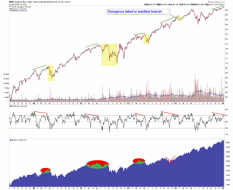
Yet another huge divergence
hygw.png (1966×874)
High yield leading the way down for stocks (and, FYI, I am stacking from an airplane; kind of a chartist's mile-hi...
1
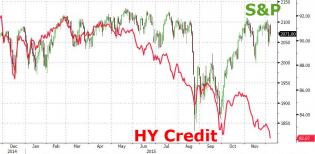
20150812_HY.jpg (1285×669)
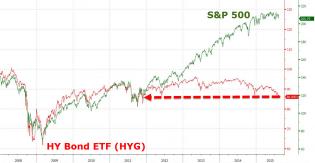
The gaping maw between high-yield credit and stocks. Quite a divergence here, wouldn't you say?
3
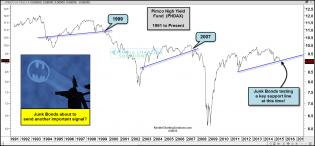
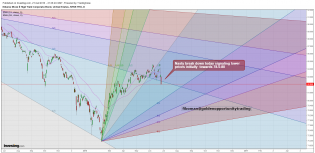
junkbondpimcotestingsupportjune30.jpg (1571×731)
High-yield junk bonds could be pointing toward stock weakness
1
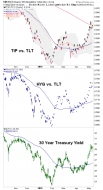
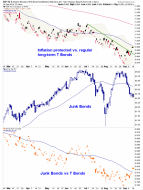
tip.tlt
3 different items with nearly identical patterns imply inflation expectations bounce (only).
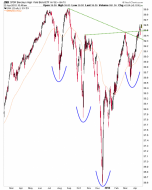
jnk
Creepy looking bullish pattern in junk bonds. A negative for market bears as long as it exists.
hyg
Risk is 'ON', and that is the point. Weeks ago we posted risk 'ON' (see post this chart goes w/ if you want) when...
hyg
Junk bonds not negatively diverging stocks. Sentiment is over bullish, but technicals on indexes are good. Watch...
1
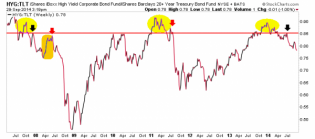
hyg.tlt
Speculation (risk 'on') is waning. The question is whether Junk-T Bond will bounce to the red line as it did in '0...
tip.tlt
Risk on or off?? TIP-TLT bouncing, indicates PM's and commods can bounce. Junk bonds down but up in relation to...
pimcohighyieldfundrepeatingmessagesept13.jpg (1567×728)
Junk bonds look to be in trouble
2
hyg.tlt
Careful bears... HYG vs. TLT is sneaking to risk 'ON'.
hyg
Nominal junk bonds declined, but its spreads to 'quality' bonds did not, and this is a sneaky risk 'ON' indicator,...
hyg.lqd
Risk 'ON' getting a nice bounce today. Return chasers in full swing today, likely not to end well.
hyg.tlt
Sneaky risk 'OFF' signal still in play w/ junk bonds dropping vs. T bonds. Nominally junk is still okay, but this...
hyg
Nowhere is 'risk on' so evident as in junk bonds. HYG has a neg. RSI divergence, which has often preceded correction...
1
hyg
Junk bonds and ratios to investment grade and T bonds are bullish divergence for the market.
tlt.hyg
While we wait to see if TLT holds the trend line we note that HYG-TLT ratio shows no hidden negative divergence to...
hyg.lqd.bkx.spx
Two market leadership ratios (HYG-LQD & BKX-SPX) are under threat w/ BKX-SPX the most important, making a lower lo...
1
au.debt
Where is the bubble? In gold or in developed nations' ability and willingness to create credit/debt to meet every...
hyg
Junk bonds (ultimate 'RISK ON') are negative today & that's a neg. divergence to the market.
3
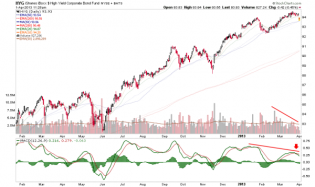
junkbondsbearishwedgebreakdownjune13.jpg (1546×647)
Junk Bonds acting rather Junkie of late! Next key move is…
hyg
Junk bonds cracking below 50 day avg's for 1st time since Nov and before that, last spring. Not a good sign for y...
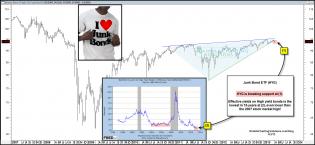
hygbreaksupporteffectyieldsapr31.jpg (1576×728)
Junk Bond ETF breaks support…Effective yields lower than 2007 stock market highs!
hyg
Junk is cracking a bit today. Bear case needs Junk to tank and lead market down.
hygjnksupportfeb4.gif (1559×693)
High yield ETF's (JNK & HYG) are both on 16-month support lines in the 2-pack above. Each time these declines hav...
hyg
Party on Garth! Junk bonds continue to rise, implying speculation. Gold, T bonds and USD decline. Ha ha ha..
hyg.lqd
Junk vs. investment grade bonds are an indicator on the will to speculate. Made a move today, bulls need it up an...
jnkhyg500breakstruggleatresistancesept4.jpg (1562×669)
j