Browse Symbol Stacks: IBM
slopechart_IBM.jpg
IBM - What can you say!?

slopechart_IBM.jpg
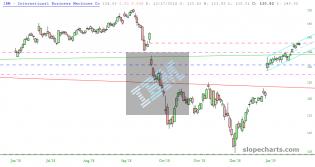
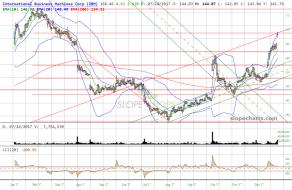
$IBM heading for the gap

slopechart_IBM.jpg
It was 10Oct when I first posted the chart of IBM, when price was pressing against the top of the purple channel....
1
slopechart_IBM.jpg
IBM - Whoops.
2
slopechart_IBM.jpg
IBM - Parabolic move up, break then backtest of rising wedge, now doji.
Purple reigns.
1
slopechart_IBM.jpg
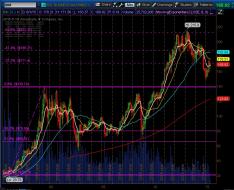
Stretched IBM.
Breaking below the blue dashed line increases the odds of breaking the lower blue uptrend and hori...
slopechart_IBM.jpg
Violet, I'm sure you've looked at IBM's monthly chart as well...
1
slopechart_IBM.jpg
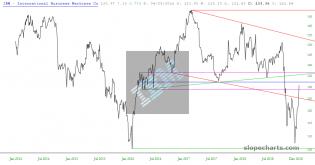
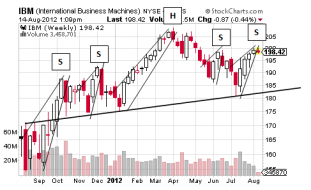
IBM Monthly
slopechart_IBM.jpg
IBM Monthly
slopechart_IBM.jpg
Good place to short IBM?
slopechart_IBM.jpg
What changed in Nov 2022 for IBM?
For twelve years it stayed in a sideways range; in Nov it breaks out above.
2
slopechart_IBM.jpg
So excited to have spotted this one. I wish I would of taken advantage of it yesterday - but I actually kind of f...

slopechart_IBM.jpg
Of Course IBM!
slopechart_IBM.jpg
2 Months of Window Dressing. So IBM will just turn around and join the metaverse? Highly manipulated - careful wit...
slopechart_IBM.jpg
Great Iron Condor trades

slopechart_IBM.jpg
$IBM gap from October acting as resistance

slopechart_IBM.jpg
Earnings today on IBM. Will be looking for a short entry around the bottom of broken bullish green trendline.
1

slopechart_IBM.jpg
Nobody ever got fired for buying IBM (computers, not the stock)

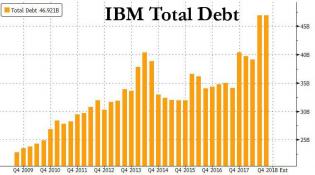
IBM total debt.jpg (759×424)

1
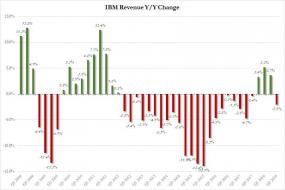
IBM revenue Q3.jpg (831×554)
1
slopechart_IBM.jpg
$IBM already @ 78.6% $168.88

2
IBM_Monthly_June102015.jpg
IBM on the long look.
Show disbelievers in technical analysis this chart next time they speak.
Pretty much n...

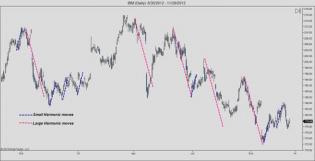
The Market Zone | How to use Harmonic patterns?
How to use harmonic patterns in trading: http://www.themarketzone.net/

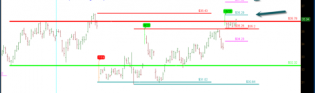
image.png
More Bearish Charts SBUX and IBM

Live Real-Time Updating Trading Charts and Ideas by Chris Vermeulen
PRICE & VOLUME ---- ONLY PRICE PAYS ---- No Fluff Just Trading S...
Live Real-Time Updating Trading Charts and Ideas by Chris Vermeulen

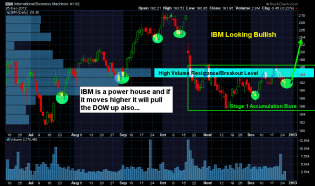
ChrisVermeulen - $IBM Stage 1 Basing Pattern - Get ready for a r...
IBM building Stage 1 Accumulation base and is 13% of DOW Jones Average

BA-BA513B_Outlo_G_20121215011209.jpg (555×1457)
Complex H&S in IBM Should Knock Shares Down
Dear Abigail.....