Browse Symbol Stacks: IEI
Bonds continue to indicate contrarian potential – Notes From t...
Treasury bonds continue to indicate an oncoming contrarian play...

Does this look like inflation? – Notes From the Rabbit Hole
Does this look like inflation? I didn't think so.
1
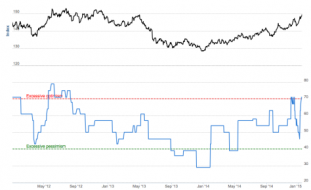
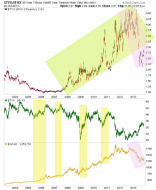
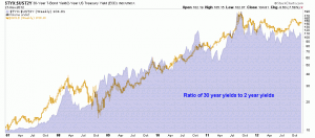
30yr 5yr yield curve
30yr-5yr yield curve did tw...
2
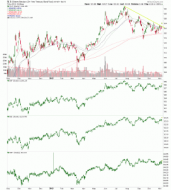
slopechart_IEI.jpg
Treasury market is multiples bigger than stocks

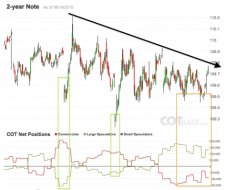
2yr
Short-term interest rates could be about to rise. 2yr T note is in bearish CoT setup.
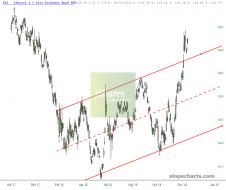
tlt.ief.iei.shy
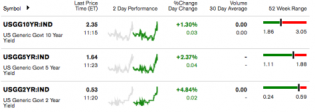
Given the reduced risk, I bought back 'cash equiv' SHY and IEI. Not interested in the longer end stuff until I ge...
30yr.optix
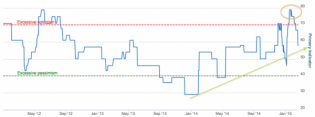
T bond sentiment backdrop is improved from 3 weeks ago. Way over bullish Optimism Index back then.
tbond.optix
Public in love with long-term Treasuries. Year ago, hated. T bonds are are short IMO. Over done.
10.5.2
Yield curve declines while nominal yields rise. Message if you choose to go w/ one day's data is... risk 'ON'. Al...
1
tyx.fvx
Yield spreads have not turned Gold Bug Friendly yet... 30-5 and 10-5 at new lows.
1
30.5.wk
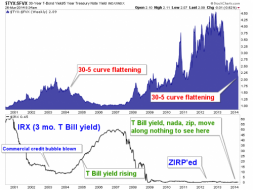
Tell me Beuller, what's different about the current curve flattening from the Greenspan era flattening?
tyx.fvx
Gold had favored bounces in long term yields until the current cycle. Top panel shows that gold actually favors r...
30.2.30.5
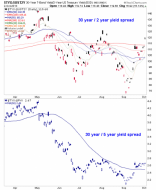
Yield spreads continue to look constructive for further rise, regardless of whether nominal yields rise or drop. T...
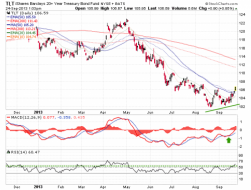
tlt
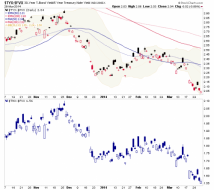
TLT continues upward, through 50 day averages. Not selling TLT or IEI until the media start hyping lower yields.
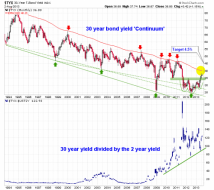
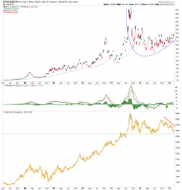
tyx
The rising yield on the long bond would normally indicate inflation, but this cycle the yield has been declining v...
1
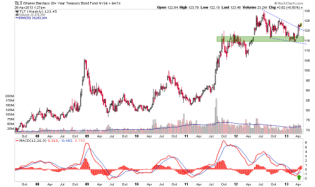
tlt
Long term T bonds fund TLT breaks out of a bullish wedge, above support.
30.2.au
30 yr / 2 yr spread gently...
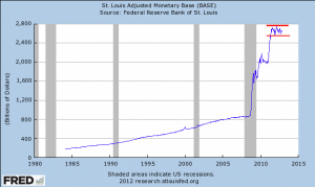
adjbase
Op/Twist has constrained Adjusted Money Supply by sanitizing bond monetization
30.2.au
Gold follows yield curve...
tlt
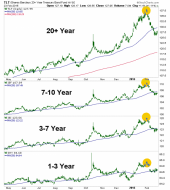
Long term T bonds out perform short term bonds... Op/Twist alive and well as Fed manip's the curve.