Browse Symbol Stacks: JNJ
slopechart_JNJ.jpg
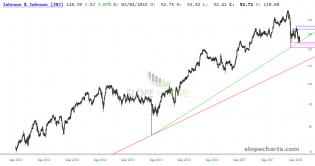
A solid perennial riding inflation up.

slopechart_JNJ.jpg
Does The State of Louisiana punch a nice hole in JNJ for the nonce? It's last up move didn't equal local maxima....
VolatilityGrid_WMT,CAT,INTC,IBM,DIS,PFE,MSFT,TRV,UTX,MCD,VZ,HD,V...
A bunch of Dow 30 stocks in the volatility matrix

slopechart_JNJ.jpg
Waiting for a strong bearish reversal candle and getting short.

2
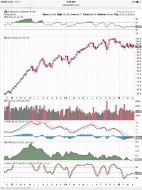
image.jpg
JNJ - long term negative divergences all over the place, nice topping pattern, and nothing but air down to $92.50....

6-stocks gaining momentum
