Browse Symbol Stacks: NFLX: slopechart_NFLX.jpg
slopechart_NFLX.jpg
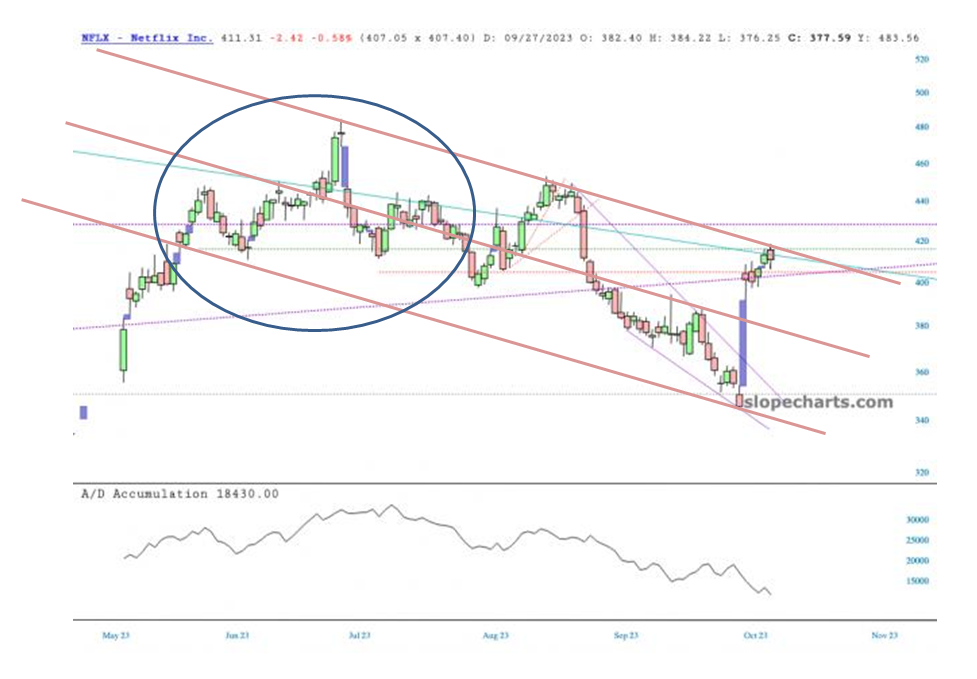
Does this chart of NFLX look strong?
Comments
 Violet


@Violet
I see it completely differently but the result is similar.
Bearish
The last couple days are mashed up against a descending trendline (heavy red line).
Lower highs and lower lows, very consistently, even in the subpatterns.
Possibly bullish
The HnS (blue circle) failed, but has now met target.
I'd probably wait to see if it breaks above the upper line, but right now it's probably a sell.