Browse Symbol Stacks: NKE
slopechart_NKE.jpg
NKE brewing an h.

1
slopechart_NKE.jpg
Swoosh gap & doji

slopechart_NKE.jpg
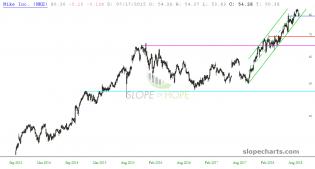
Despite NKE's impressive pop since recent earnings, price must turn 79 into support to be considered a bullish bet.
slopechart_NKE.jpg
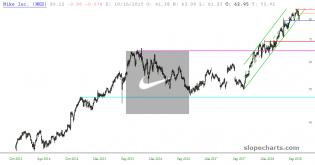
NKE meeting up with strong resistance.
Top blue downtrend line drawn months ago.
Friday's high reached bottom of...
3
slopechart_NKE.jpg
NKE topped in January this year.
It may now be ready to take another bite of the dust.
3
slopechart_NKE.jpg
NKE fate looks sealed under the dotted blue trendline.
1
slopechart_NKE.jpg
Watch very closely as breaks 15 year trend

slopechart_NKE.jpg

slopechart_NKE.jpg
CRUSHED earnings. Earnings nearly double the consensus.

1
slopechart_NKE.jpg
Big August mover
slopechart_NKE.jpg
Bullish triangle breakout vs bearish trendline failure.

1
VolatilityGrid_WMT,CAT,INTC,IBM,DIS,PFE,MSFT,TRV,UTX,MCD,VZ,HD,V...
A bunch of Dow 30 stocks in the volatility matrix


slopechart_NKE_100518.jpg
A closer look at NKE.
2
slopechart_NKE.jpg
A bounce to 83.50 after this trendline break down to 75 would be my ideal continuation.
1
slopechart_NKE.jpg
Let's see if that blue or green line acts as support.

cijf70e56hk11.png (752×800)
19E328A6-A9AD-401A-A25C-FAEC56DF445E.png
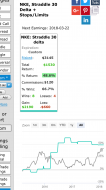
NKE straddle, enter 4 d before and exit 1 d before earnings

1