Browse Symbol Stacks: /NQ
slopechart_/NQ.jpg
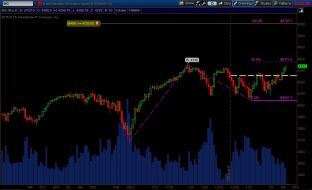
/ES - Bulkowski calls it a head and shoulders bottom. Looks like an ihs, yes? Time will tell soon enuf if a righ...

4
slopechart_/NQ.jpg
/NQ's week of the test.
TOS_Strat_SOH_10XO_2022-11-03-9.05am-10.55am.png
screen cap of automated trading NQ 2022-11-03 9:05 am - 10:55 am

s3.amazonaws.com/cdn2.soci..._k1dBxK_l.png
Profit trading 1 contract continuous open/close/open, etc always be in a position
5
nasdaq net.jpg (1280×796)
Nasdaq Shorts Hit Second Highest Ever

2
slopechart_/NQ.jpg
I don't usually short but when I do it is at 11,500!

slopechart_/NQ.jpg
Will lack of stimulus take this down?
slopechart_/NQ.jpg
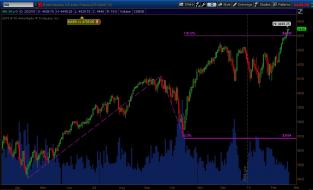
Talk about a V Bottom recovery. We passed under the the recent bullish trendline a few days ago, but we've been g...

slopechart_/NQ.jpg
The orange rectangle highlights a chart pattern known as a throwover.

2
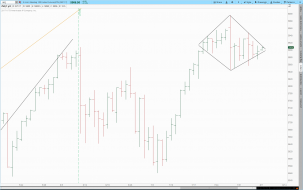
2017-08-06-TOS_CHARTSdia.png
Looks like a diamond pattern topping /NQ. If this truly is a diamond pattern, another also sits atop /ES tonight.

3

nq_Daily_ABCD_FibMove_July212015.jpg
/nq nears AB=CD move target on daily chart at 4705.50, based off the October 2014 swing low to the Nov. 2014 swing...

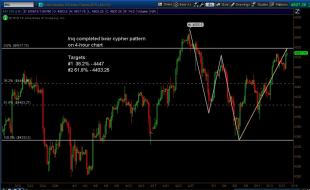
NQ_Futs_4Hour_CypherPattern_May182015.jpg
Bearish set-up fired this afternoon on the /nq.
We have a fibonacci bear cypher pattern on the 4-hour that comp...
AAPLvsNQ_Daily_April272015.jpg
Heading into AAPL's earnings this afternoon, we see the /nq start to diverge somewhat from its largest component (...
nq_Feb232015.jpg
e-mini NASDAQ 100 futures completed an AB=CD move using the two major lows of 2014.
With AAPL also having hit i...
nq_ABCDtarget_Feb122015.jpg
Just in case AAPL goes to the moon, /nq AB=CD move from the Oct. 2014 low takes us up to 4705
NQfuts_Jan222015.jpg
See what happens when Tim leaves his bear post...
UGH
1
2015-01-17-FLEXIBLE_GRID_NQ.png

content.screencast.com/use...9c/NQ3413.gif
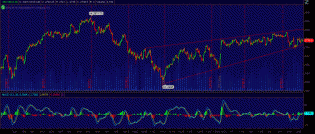
/NQ 4 hour chart. Ready for an aggressive selloff with break of bottom rising trendline.
