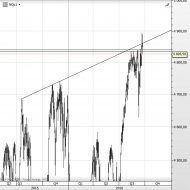
Browse Symbol Stacks: NQ
slopechart_/NQ.jpg
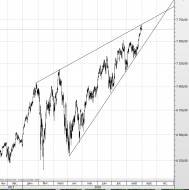
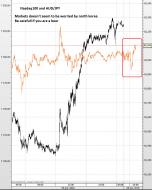
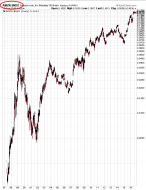
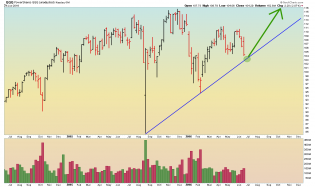
The orange rectangle highlights a chart pattern known as a throwover.

2
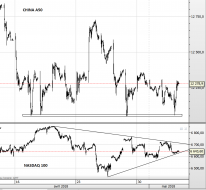
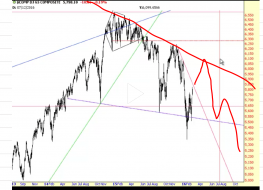
Yield Curve Patterns – What To Expect In 2020 – Technical Traders Ltd.

1 feb13.PNG

s3.amazonaws.com/cdn2.soci..._lALLr3_l.png
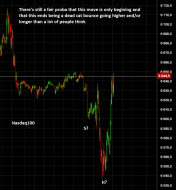
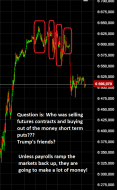
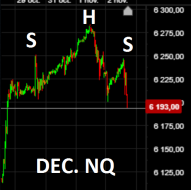
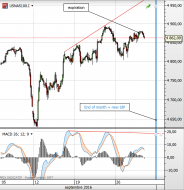
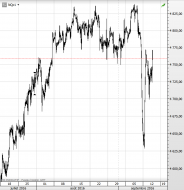
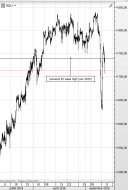
NQ test of support
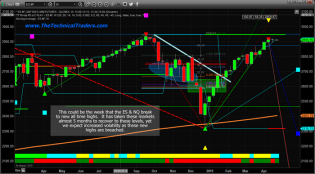
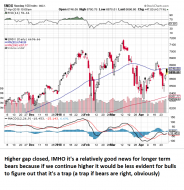
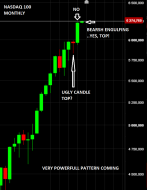
Prepare For Unknown Price Action As New Highs Are Reached – Te...
1 dec6.PNG
4
1 dec4.PNG

3 nov9.PNG

1 nov11.PNG
1
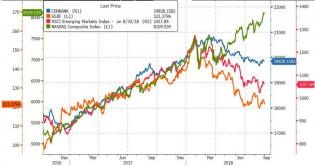
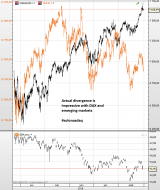
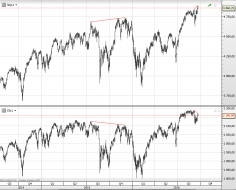
Nasdaq Surges To Best August Since 2000, Bonds Bid As EM Collaps...
Spot The Odd One Out!! US Tech stocks (green), Global Central Bank Balance Sheet (blue), Emerging Market Stocks (r...
14 aug31.png
4
13 aug31.png
12 aug31.png
11 aug31.png

8 aug31.png
7 aug31.png
6 aug31.png
2
5 aug31.png
4 aug31.png
3 aug31.png
2 aug31.png
1 aug31.png
1 aug17.png
1 july9.PNG

9 june15.PNG
1

7 june15.PNG

5 june15.PNG

1 june15.PNG
edit: not 1999 but 2000
1

7 june14.PNG

5 june14.PNG
1 june14.PNG

9 june13.PNG
3
5 june13.PNG
3
2 may16.PNG
8 may3.PNG
4 may3.PNG
5 apr27.PNG
1
3 apr27.PNG
5 apr26.PNG
4 apr26.PNG
3 apr26.PNG
![2018-04-24_9-51-08[1].jpg](https://s3.amazonaws.com/cdn2.socialtrade.com/st/shards/22348_KYfZKOL7_h)
2018-04-24_9-51-08[1].jpg
Back into the red for 2018 for the 11th time this year...
6 apr24.PNG
1
1 apr6.PNG
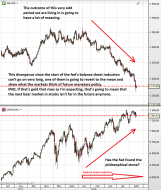
ES_YM_NQ_TF_DAX_22_02_2018.jpg
Possible measured move targets in indices,
based on (small, negative) gaps in recent price action.
Top row: ES...

5 jan3.PNG
9 nov8.PNG
2
6 nov2.PNG
2
5 nov2.PNG
4 nov1.PNG
My opinion/prediction
8 nov18.PNG
Saucer top IMO
2 sept30.PNG
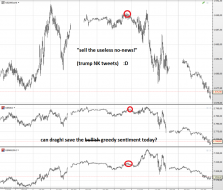
plunge protection team to the rescue?
1
4 sept29.PNG
Nasdaq100 (cash) 2H chart
3 sept29.PNG
Nasdaq 100 (cash)
7 sept27.PNG
Nasdaq100 head and shoulders top?

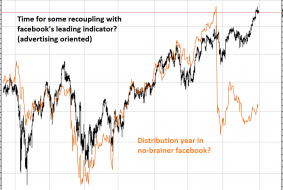
5 sept26.PNG
Same line of thought?
Too much algos participants executing systematic strategies?
4 sept26.PNG
And nasdaq100, perfect false breakout so far
Potential catalyst (wrong-foot)
4 sept23.PNG
S&P right again?
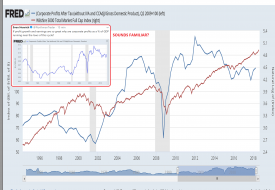
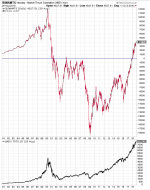
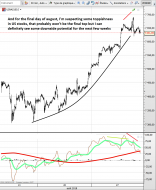
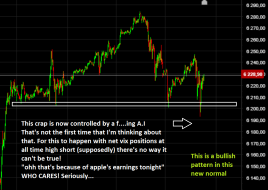
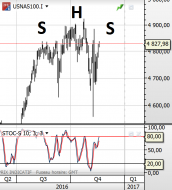
17 sept14.PNG
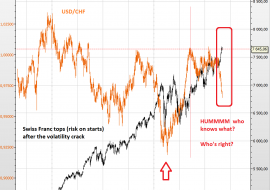
I have to admit that this one is making me "huuuuuummmm..."
So high relative to s&p right now!
2
5 sept13.PNG
Looks like a topping pattern
(I declare that i'm short AMZN)
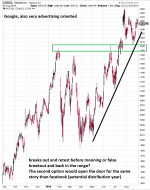
4 sept13.PNG
Amazon relative to nasdaq100
Almost the same chart as Amazon price but going nowhere since may, became proxy of n...
1 sept13.PNG
nasdaq100
14 sept12.PNG
Wild swings
Was a bear trap?
9 sept12.PNG
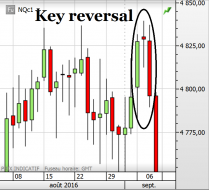
5 sept12.PNG
Didn't see this beautifull candle structure on nasdaq100
Called a "key reversal", a very powerfull reversal pattern
2
8 sept10.PNG
Series of big theoric warnings so far
Also an ugly weekly candlestiks structure on russel2000
Dow theory still i...
7 sept9.PNG
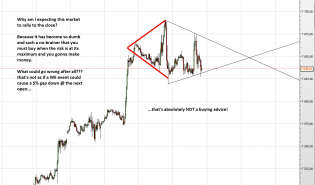
I clearly recommend you not to buy
I think it's just the beginning and FAR FROM OVER
Today was mainly stops to m...
NDX - Monthly - 8.25.16.png
NDX - monthly chart. This is not investment advice.

2
QQQ - Daily - 6.27.16.png
QQQ daily. This is not investment advice.
3

NDX - Daily - 6.6.16.png
NDX Daily. This is not investment advice.
1
Screenshot_2016-02-21-14-35-14-1.png
Another trendline
2
NDX Weekly - 2.10.16.png
NDX Weekly.
2
poop.png
pattern looks similar to late December 2014


SPX_DLY_2013-10-14_2150.png
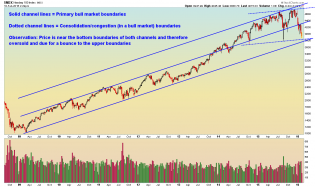
SPX

1