Browse Symbol Stacks: RUT
A Combination Topping Pattern Is Setting Up – Technical Traders Ltd.

1
The Wuhan Wipeout – Could It Happen? – Technical Traders Ltd.
Q4 Earnings Setup The Rally To The Peak – Technical Traders Ltd.
US Indexes Continue to Rally Within A Defined Range – Technica...
G20 News Drive Big Moves In The Markets – Technical Traders Ltd.
My index trend and trading strategy signal – Technical Traders Ltd.
Small Caps May Lead A Market Rally – Technical Traders Ltd.
Adaptive Price Modeling Suggests Big Rotation In US Dow Stocks...
US Memorial Day Weekend Market Analysis – Technical Traders Ltd.
US Increases Trade Tariffs Against China – Markets, Gold, and...
The Shake-Out Continues – Where Is The Bottom? – Technical Trad...
US/China Trade Issues Create SHOCKWAVE Around The Globe – Technic...
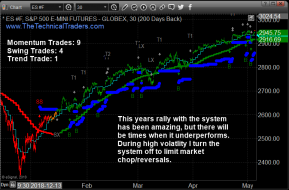
Index Trading Signals for Momentum, Swing, and Trend Following...
US Fed Leaves Rates Unchanged – The Shake-Out Begins – Technica...
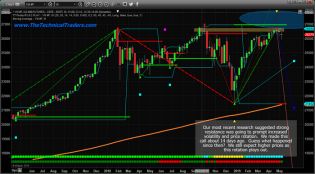
Chart3.png (700×387)
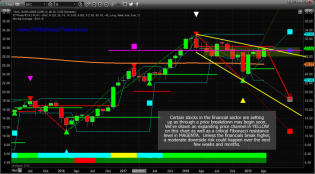
Watch The Financial Sector For The Next Topping Pattern – Technic...
1 jan12.PNG

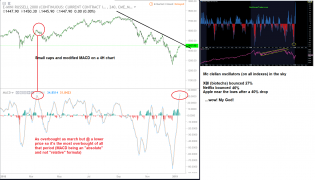
Rut… No, Not Yet – Notes From the Rabbit Hole
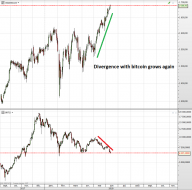
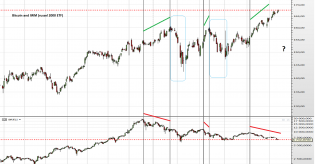
RUT/SPX leadership should be watched. It's firmly down trending.

1
Rut… No, Not Yet – Notes From the Rabbit Hole
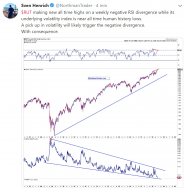
RUT is the downside leader, possibly neg. diverging USD.
7 june13.PNG
4
6 june13.PNG
4 june13.PNG
3 june13.PNG
2 june13.PNG
1 june13.PNG
2
7 june12.PNG
6 june12.PNG
2
5 june12.PNG
3 june12.PNG
2 june12.PNG
1 june12.PNG
2 june11.PNG
1 june11.PNG
2 nov19.PNG
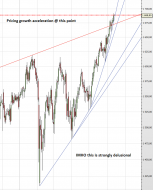
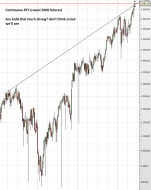
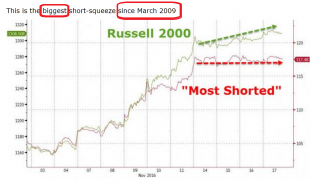
Extremely overbought indicators
Not surprising after a +14% low to high in less than 12 trading days, without i...
3 nov17.PNG
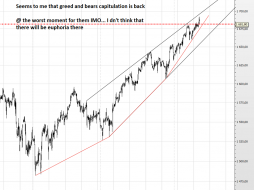
I mean... isn't what U should expect before a crash?
![20161117_EOD4[1].jpg](https://s3.amazonaws.com/cdn2.socialtrade.com/st/shards/19018_hcWg2ASV_h)
20161117_EOD4[1].jpg
no comment.... except lol
3
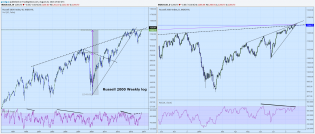
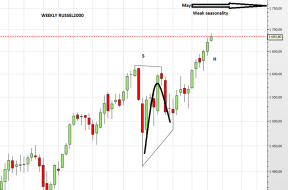
Chart1 Russell 2000 weekly and daily log.png
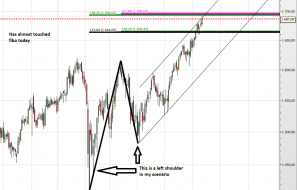
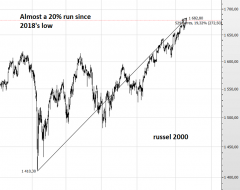
Posting two charts that suggest to me that this would be an excellent time for the Russell 2000 to reverse. Also s...

2
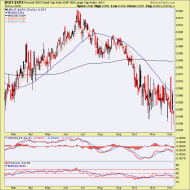
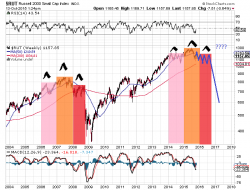
IWM - Monthly - 7.29.16.png
IWM - monthly chart. This is not investment advice.

3
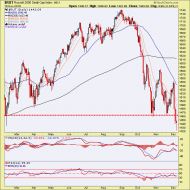
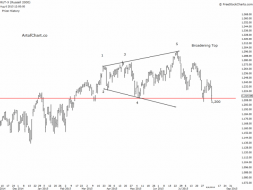
rut.png
R U ready for another year of rangebound markets?

5
Russell
A Rare Pattern On The Russell

1
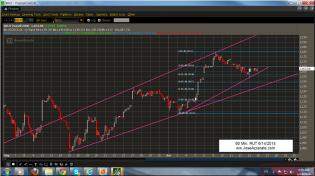
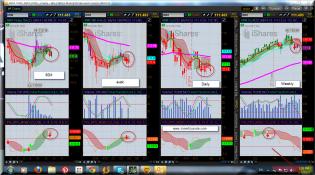
60 Min Chart - RUT 6-14-2014.jpg


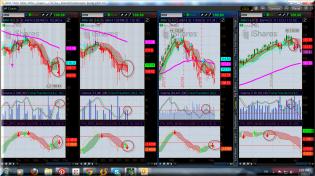
RUT NDX and SPX Weekly Charts 6-14-2014.jpg
1

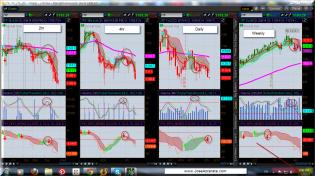
RUT NDX and SPX Daily Charts 6-14-2014.jpg
6
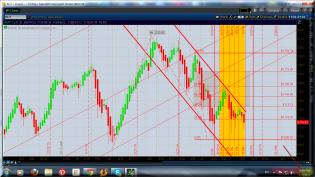
5-8-2014 3-08-09 PM.jpg
Crazy moves today but in the end it seems that the direction push to the down side will prevail. Patience..
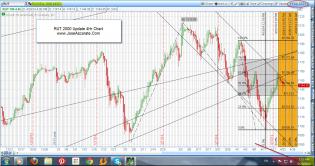
RUT Channel Update.jpg
RUT Futures Update.jpg
Enjoying the ride.. This is an update to a prior posting a couple of days ago.
IWM RUT Signals Down To Consider.jpg
Lower time frames moving in the direction of the weekly.
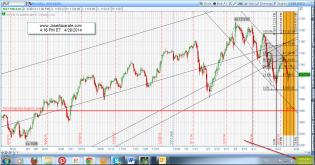
RUT Update 4-29-2014 4-15-24 PM.jpg
So far so good..

Futures - IWM RUT SPX 4-18-2014 - 3.jpg
The day is setting up to be an up day so far. The RUT continues to show weakness while the others are heading up....
1

4hr Chart TF NQ ES YM VX ZB 4-25-2014 7 30 AM ET.jpg
This chart confirms the move to the down side is coming or has started... Happy trading. Take opportunity of the...
3

Update IWM RUT SPX NDX 4-25-2014 7 26 AM ET.jpg
Update to graph from earlier this week. Based on futures this morning, it seems at this time that the move down t...
Rut Update 4-25-2014 7 AM ET.jpg
An update to my prior posting earlier this week. The trend continues to hold.

RUT NDX and SPX Charting - Jose Azcarate.jpg
It may take a day or two to have confirmation.
4

SPX_DLY_2013-10-14_2150.png
SPX

1
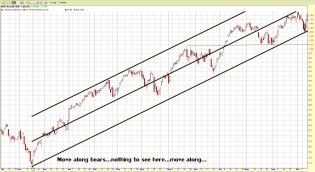
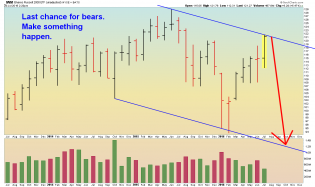
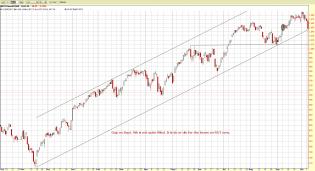
10-11-2013 RUT.jpg
Move along bears...nothing to see here...move along...
Paint the trend lines a little thicker to get rid of those...

2
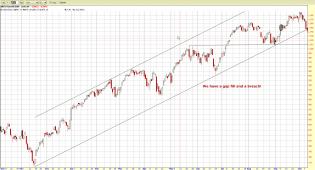
RUT 10-9-13.jpg
Gap fill and trendline breach
3
RUT 10-8-13.jpg
1
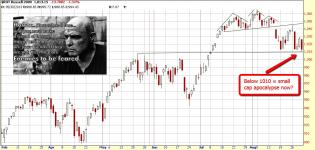
RUT.jpg
2
content.screencast.com/use...d/RUT7113.gif
At the risk of sounding like an Elliot Waver, I'm going to extend this out a bit... lol. Please no letters or ema...

content.screencast.com/use...RUT121412.gif
RUT Daily Chart
All backtests complete, nothing standing in the way of a move down to the neckline around 620....
content.screencast.com/use.../RUT61812.gif
1