Browse Symbol Stacks: SHV
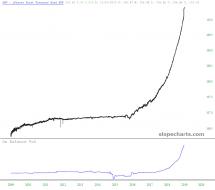
2 year treasury note yield
2yr yield ticks a higher high to the last high, and Stagflation has to be brought back into the discussion (linked p...

The tardy Fed and the new macro | Notes From the Rabbit Hole
Here on Fed day, behold distortion #2 (there are others)...
The tardy Fed and the new macro | Notes From the Rabbit Hole
Here on FOMC day, behold distortion #1...
1
2 year US Treasury bond yield
Proof positive that market analogs will fuck you up when you least expect it as stock bear began well ahead of the...
Bonds continue to indicate contrarian potential – Notes From t...
Treasury bonds continue to indicate an oncoming contrarian play...
T-Bill yield up, RINF down today – Notes From the Rabbit Hole
Curious divergence today as 3 mo. T-bill yield is up, inflation expectations tracker down.
Eggheads tardy in doing the right thing – Notes From the Rabbit Hole
Finally the Fed is set to get off its ass months after the market signaled it to do so.
Fed not hawkish; hellflation or liquidation ahead | Notes From t...
Fed is dovish by definition of its gap with the 3 mo. T-bill yield.
1
Gold/Silver ratio continues to diverge the inflation trades | No...
Why is the Fed so aggressively out hawking in the media? Because, this... (they're behind the curve).
Fed Jawbones mean business | Notes From the Rabbit Hole
Check out the orange line. Fed jawbones are not kidding. They are listening to what the bond market is DEMANDING o...
Stories from the bond market as the Yield Curve Steepens | Notes...
I don't know, it's just a scary chart is all. And it does not even include the Fed's latest plunge back to ZIRP.
cme fed funds futures
Fed Funds futures...
fed funds rate
Fed Funds and the Business Cycle...
fed funds and financial crises
Fed Funds and historical crises...
fed funds rate
Fed Funds Rate...
cme fomc
Now a 100% chance of a .5% Corona-cut coming at or before the March 18 FOMC meeting.
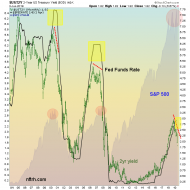
2 year yield, spx, fed funds
The mother of all bond charts shows that the stock market is in massive trouble if the last 2 occurrences are good...
1
slopechart_SHV.jpg
Fear Factor?

3
How Low Could the S&P 500 Go? – Notes From the Rabbit Hole
Market indicators are in high risk stance relative to the false alarms in 2011 and 2015.
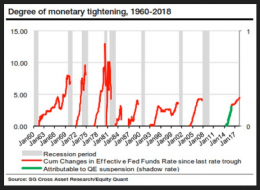
Garth! – Notes From the Rabbit Hole
By way of Macro Tourist, shadow tightening has already signaled danger. Powell caving?
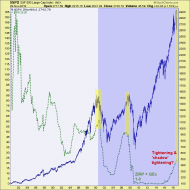
Garth! – Notes From the Rabbit Hole
So, is this cycle going to be different from the last two? And if so, why? Party on Garth... very temporarily.
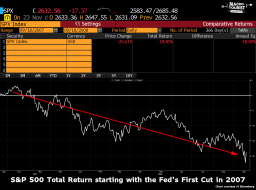
A History of First Cuts – No robo-content, no ads and no bullshit
Macro Tourist's history of first cuts...
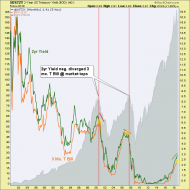
2 year yield & t bills
Condition to 2000 & 2007 tops not yet in place. That's the relationship between 2yr yield & 3 mo. t-bill.
spx.monthly
Big macro chart of S&P 500 and the blight known as ZIRP. This one chart ends all discussion about whether stocks...
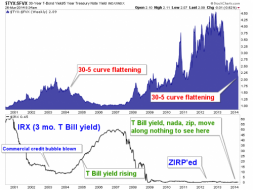
30.5.wk
Tell me Beuller, what's different about the current curve flattening from the Greenspan era flattening?
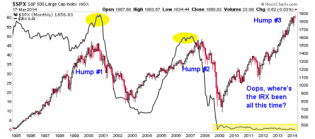
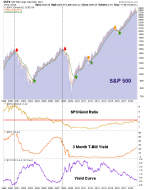
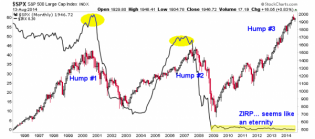
spx.irx
Let me ask you something... what is wrong w/ this chart? I mean really, SPX Humps 1 & 2 were fairly normal, with...