Browse Symbol Stacks: /SI
slopechart_/SI.jpg
/SI - Above the blue, silver is gold.

2
slopechart_/SI.jpg
/SI - Price staying above the top green line, any pullback to it, is a buy.
slopechart_/SI.jpg
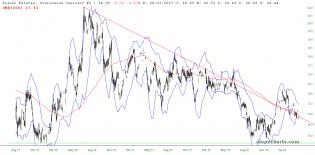
/SI - Silver pressing up against resistance of the bottom of the Cloud. Price staying above the top green trendli...
1
slopechart_/SI.jpg
/SI update.
Precarious positioning.
Convergence of trendline support and resistance levels, telling you which s...
1
slopechart_/SI.jpg
Will purple reign for /SI?
Wouldn't it be something if it sprang back to life from here.
slopechart_/SI.jpg
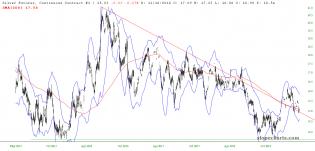
Sell signal for /SI if price falls below green dashed trendline.
6
slopechart_/SI.jpg
Silber

slopechart_/SI.jpg
Silver
slopechart_/SI.jpg
Have a cup or two of /SI.
2
slopechart_/SI.jpg
Reposting /SI - looks like a good setup...to move up.
slopechart_/SI.jpg
/SI - if it finds support here, buy Silver.
slopechart_/SI.jpg
/SI looks poised to take out the top orange channel and blue downtrend.
1
slopechart_/SI.jpg
We need one more push for a breakout
2020-07-20_5-23-14.jpg (1246×668)

1
slopechart_/SI.jpg
Potential bear flag on /SI, plus a bearish engulfing candlestick.
1
slopechart_/SI.jpg
Silver is sporting a nice little IH&S pattern which measures to 20.30ish.

4
slopechart_/SI.jpg
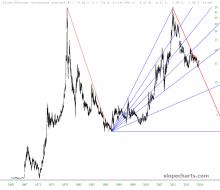
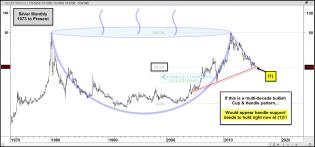
/SI 40 years, cup & handle in the making
1
slopechart_/SI.jpg
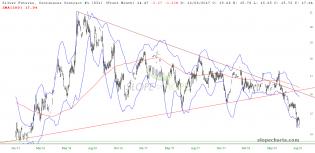
/SI's pullback could be as impressive as its climb.
slopechart_/SI.jpg
/SI, death by a thousand cuts. The chart from 2011 is too brutally graphic to display in public.
slopechart_/SI.jpg
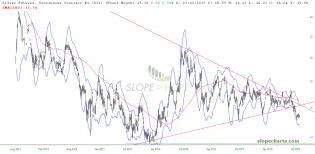
Could be worse, let's see if /SI can stay above the falling 200D & descending trendline.
slopechart_/SI.jpg
Sludge

slopechart_/SI.jpg
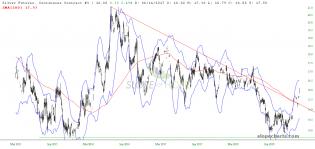
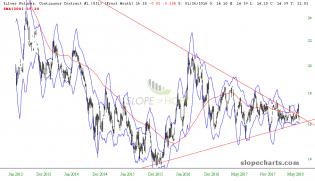
SI breaks convincingly over the descending trendline. It needs to close above the June 2018 high to signal a trend...
slopechart_/SI.jpg
13.70 is looking like a good target.
1
slopechart_/SI.jpg
Anyone looking to buy physical loves this chart.
slopechart_/SI.jpg
A false break near the tip is usually bearish. A false breakout often results in a strong move in the opposite dir...
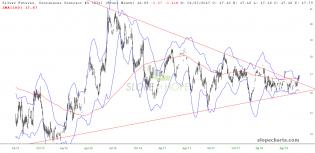
slopechart_/SI.jpg
/SI looks interesting, above the 200 day but it needs to get above the January high.
1
blog.kimblechartingsolutio...ernjuly16.jpg
The Cup & Handle...as God intended. Silver Monthly chart!

2