Log In
|
Create Account
Analyze
Backtest Strategies
Correlations
Custom Earnings
Market Meter
Payoff Analyzer
Reaction Graph
Relative Rotation
SlopeCharts
Super Summary
Volatility Matrix
Learn
Chart Patterns Guide
Educational Videos
Historical Volatility
IV Rank
Options Chains
Premium Videos
Recommended Books
Strategy Guide
Technical Studies
Video Tutorials
Monitor
Alerts (SMS & Email)
Big Movers
Chart-Based Alerts
CryptoStream
Earnings Calendar
Meter Matrix
Sector Performance
SlopeMATRIX
SlopeRules Alerts
TradeMachine Pro
Read
Best Posts of All Time
Books by Tim
Comments Search
Discussion Forum
Hall of Fame
Knowledge Base
Latest Posts
Macroeconomics
Reports Calendar
Slope Mobile Apps
Share
Activity Feed
Android & iPhone Apps
Browse SocialTrade
Followed Stacks
Labels & Filtering
Members Directory
Published Watch Lists
Recent Additions
Search SlopeRules
Woulda Shoulda
Virtual
Account Balance
Brokerage Login
Current Positions
Former Positions
Guide to Virtual
Open Orders
Place Trade
Strategy Wizard
Top Ten Traders
Trading Results
Help
About Slope of Hope
Best Pages For You
Guide to SlopeCharts
Guide to SlopeMATRIX
Guide to SlopeRules
How To Use Slope
Memberships
TastyWorks Brokerage
Tim Knight Profile
Using Comments
Log In
Create Account
Memberships
Browse
Symbol Stacks
: SO
slopechart_SO.jpg
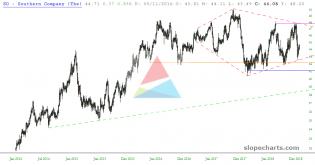
Utilities seem to be showing continued weakness.
slopechart_SO.jpg
Red diamond pattern.
2
slopechart_SO.jpg
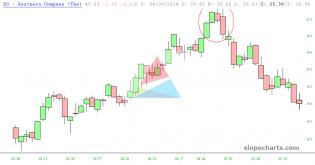
Successful bearish harami. Not current.
1
slopechart_SO.jpg
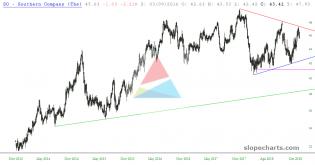
Bounced off that bearish trendline perfectly. The way God intended.
slopechart_SO.jpg
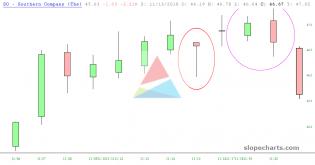
Hanging man candlestick in red circle. Bearish engulfing 2 candlestick pattern in pink circle.
slopechart_SO.jpg
New polygon H&S $SO
We got ourselves a pretty nice sell-off into the close that took us from green-to-red on the day. Being how overbought we are when this occurred, coupled with the light volume, I think there is a better than average chance we continue...
6 Big Name Short Setups For Tomorrow | SharePlanner
14 Stocks That Only Go Up