Browse Symbol Stacks: $SOX
slopechart_$SOX.jpg
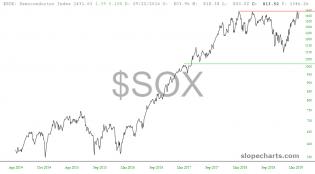
$SOX - Oops, there it is, price fallen from the channel.
It's done it before and can again jump back up, but the...

slopechart_$SOX.jpg
SOXS - Price likes the red line: bullish above; bearish beneath.
1
slopechart_$SOX.jpg
SOXS - Price likes the red line: bullish above; bearish beneath.
slopechart_$SOX.jpg
$SOX: Red line rules: bullish above; bearish beneath.
Friday's break above the red line is bullish. If price f...
1
slopechart_$SOX.jpg
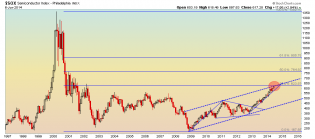
On Friday $SOX broke out above long term resistance trendline from 2010. It may be slim, but the chance to stop t...
2
slopechart_$SOX.jpg
I would say it's getting close to being shortable, but I won't.

slopechart_$SOX.jpg
Triangle pattern forming for a swing trade opportunity.
slopechart_$SOX.jpg
Will the bulls make a 3rd charge at the gap next week?
2
slopechart_$SOX.jpg
If you are looking to short the semiconductors, now is a good time risk-wise with a stop at 1446.
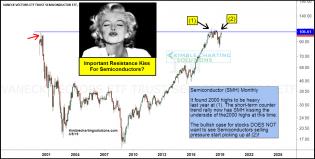
semiconductors-kissing-resistance-2000-highs-march-6.jpg (1266×641)

D0Ruy_iUcAA7h8m.png:large (1200×950)
1
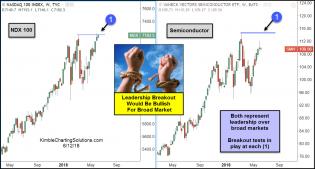
ndx-smh-breakout-attempts-june-12.jpg (1239×665)
1
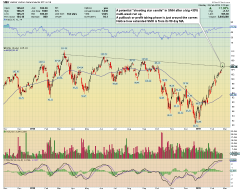
SOX Index - 6.8.14.png
Semiconductor Index - This is only an opinion. This is not investment advice.

4
sc.png
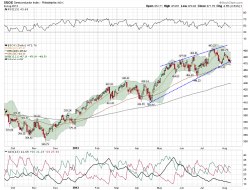
SOX finally broke this multi-month, wedge-like pattern .. it is showing relative weakness in a very strong (and pe...
