Log In
|
Create Account
Chart
Chart Lab
Drawn Objects ➟
Earnings Reactions
Guide to Patterns ➟
Modes ➟
Power Features ➟
Rotation Graphs
SlopeCharts
Videos for SlopeCharts
Yield Curve
Equities
Biggest Stocks
Calendar of Earnings
Correlations
Earnings ➟
Historical Earnings
Market Capitalization
Power Screener
Super Summary
Volume/Price Leaders
Woulda Shoulda
Markets
Automatic Reports
Commodities
CryptoStream LIVE
Economic Database
Global Economics
Macroeconomics
Market Meter
MetaSymbols
Quad Matrix
SlopeRules
Options
Analytics ➟
Backtest Strategies
Earnings Calendar
Extreme Options
Historical Charts
Matrix of Volatility
Open Interest & Volume
Payoff Analyzer
Strategy Explorer
Volatility Calendar
Read
Best Posts of All Time
Books by Tim Knight
Comments Search
Guide to Comments
Latest Posts
Mobile Apps
Profile of Your Host
Recommended Books
Ticker Stripper
Trading Rules
Social
Activity Feed
Browse Chart Database
Hall of Fame
Members Directory
Publishing/Subscribing
Recent Activity
Search SlopeRules
Shared Labels & Lists
SlopeTalk LIVE
Trader’s Diary
Help
Best Pages for You
Charts Overview
Guide to the Site
Membership Levels
Pattern Video Library
Power Screener Guide
Premium Memberships
SlopeCharts Reference
Using SlopeTalk Chat
Video Tutorial
Log In
Create Free Account
Memberships
Browse
Symbol Stacks
: STLD
slopechart_STLD.jpg
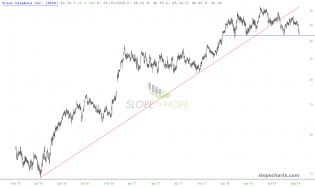
Long term horizontal bullish breakout held. Could be a dip buying opportunity.
slopechart_STLD.jpg
a couple of bullish breaks
slopechart_STLD.jpg
Something's gotta give. On a close over triangle I would look for 29.30 and on a close under I would look for a ga...
slopechart_STLD.jpg
STLD - ready to finish the top...
2
Stld.png
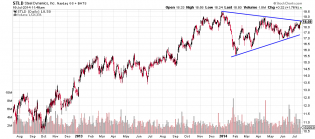
STLD: Symmetrical Triangle. Ready to break out around 18.65. Price target 22-23.
1