Browse Symbol Stacks: TF
ES_YM_NQ_TF_DAX_22_02_2018.jpg
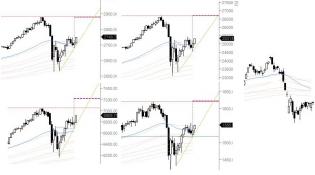
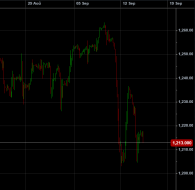
Possible measured move targets in indices,
based on (small, negative) gaps in recent price action.
Top row: ES...

![20170302_EV1_0[1].jpg](https://s3.amazonaws.com/cdn2.socialtrade.com/st/shards/19704_WzXsAg4t_h)
20170302_EV1_0[1].jpg
Hey Tim! Concerning valuations I prefer this chart ;)

1 nov25.PNG
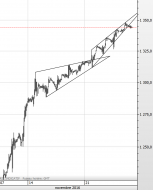
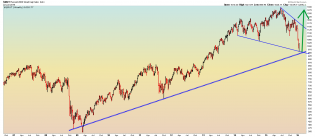
Russel 2000 futures
19.96% from the elections results low on nov9
1
3 sept16.PNG
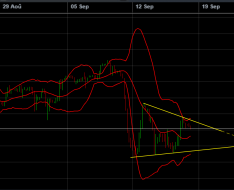
Russel2000's breath and patterns
1
2 sept16.PNG
And russel2000 still looks like an inverse cup with handle pattern consolidation
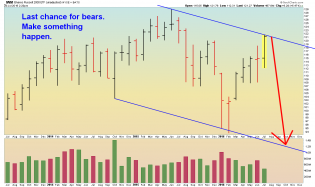
7 sept14.PNG
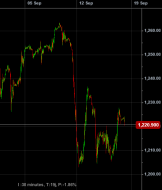
Russel 2000 futures
Inverse cup with handle consolidation pattern???
IWM - Monthly - 7.29.16.png
IWM - monthly chart. This is not investment advice.

3

IWM - Weekly - 6.27.16.png
IWM weekly. This is not investment advice.
3
Russell 2000 - Weekly 1.22.2016.png
Russell 2000 weekly shows bullish falling wedge back to bull market trendline support. This is not investment advice.
5
Today’s forecast for ES… Bullish as long as it doesn’t breach the RED line at the bottom. I will post these whenever I get a signal on each symbol.Please comment if you want more info on the chart. Please read HOWTO before tryin...
10-29-2013– e-Mini futures Forecast for the day | Are We There Yet

2

SPX_DLY_2013-10-14_2150.png
SPX
1