Browse Symbol Stacks: TLT
slopechart_TLT.jpg
TLT - Bonds, the issue that matters most. In a bear market since 2020, threatening to rise up out of it.

4
slopechart_TLT.jpg
94 in the cards??

slopechart_TLT.jpg
TLT isn't looking too peppy and sporting quite a pennant.
3
slopechart_TLT.jpg
inverse H&S failing
slopechart_TLT.jpg
What are Treasurys up to?
A top in Mar 2022 and a bottom in the making?
2
slopechart_TLT.jpg
TLT struggling to hold the supporting TL
will we see sone upside into year end?
1
slopechart_TLT.jpg
technically, getting somewhat compelling
fundamentally, it's another story
slopechart_TLT.jpg
Fwiw, TLT looks mighty weak.
Gap fills above, but twin tails of 89.23 and 89.21.
1
slopechart_TLT,$VIX.jpg
TLT vs VIX
2
slopechart_TLT.jpg
channel holding so far
slopechart_TLT.jpg
Channel?
1
slopechart_TLT.jpg
Will Bonds crack the resistance?
slopechart_TLT.jpg
Talk of the town TLT monthly with a losing red candle.
5
slopechart_XLU,IEF,TLT.jpg
utilities vs bonds
1
slopechart_XLU,TLT.jpg
Utilities vs bonds
slopechart_TLT.jpg
TLT looking down and out.
Green 2002 trendline must hold to avoid falling to lower levels of support.
2
slopechart_TLT.jpg
hip to be square
A deflationary yield curve steepener
Deflation scare upcoming in 2023 IMO. Yield curve indicates the first impulse. Linked post explains.

Inflation Expectations | Notes From the Rabbit Hole
So we have a booming jobs report... and the bond market's inflation signaling is not buying it.
bonds_4.jpg (875×500)

1
SPY vs. SP… err, TLTNotes From the Rabbit Hole
Trend for stocks (incl. dividends) vs. L/T T bonds (incl. div) still intact. Expecting this to change in Q1/H1, 2023.
'real' 10 year Treasury yield
If the 'real' 10yr yield turns down a tail wind for gold ensues.
s3.amazonaws.com/cdn2.soci..._b3Tgqm_l.jpg

slopechart_TLT.jpg
TLT peaking out above the down trendline.
5
Bonds continue to indicate contrarian potential – Notes From t...
Treasury bonds continue to indicate an oncoming contrarian play...
30yr on the way to 2.5%? – Notes From the Rabbit Hole
30yr yield headed to 2.5% (monthly chart) even as the eggheads prepare to hike.
30 year treasury bond yield
30 year yield headed to 2.5% (daily chart) even as the eggheads prepare to hike.
Does this look like inflation? – Notes From the Rabbit Hole
Does this look like inflation? I didn't think so.
1
slopechart_TLT.jpg
Ooops!
2
The Pigs are not leading yields | Notes From the Rabbit Hole
The Pigs are negatively diverging long-term yields and that is important...
Fed not hawkish; hellflation or liquidation ahead | Notes From t...
Continuum... do or die baby! Do or die...
high yield credit spreads
Rising credit spreads not positive for economy (Captain Obvious).
slopechart_TLT.jpg
For what it's worth, TLT stopped to the penny at the 61.8% Fib (from Dec high to recent low).

slopechart_TLT.jpg
(Manual) TLT Fib projection onto the Dec high, target 120
“The Fed is likely…” | Notes From the Rabbit Hole
No hike today, but it's highly doubtful the market correction will bump the Fed off of a hike in March.
1
Gold; a stellar picture | Notes From the Rabbit Hole
Gold's risk vs. reward not yet activated, but it is stellar. Peer into the chart and let it tell its story (or rea...
Two important macro indicators remain intact | Notes From the Ra...
If inflation trades do continue, have max caution at the red lined limiters (around 2.5% on the 30yr).
tyx
Implications of rising long-term yields?
Say, do you think risk is still ‘on’? | Notes From the Rabbit Hole
Message from junk bond land... risk still 'on' as of now.
yield curve
Yield curve shows current Goldilocks flattener with 2022 to either stay that way (unlikely), morph to higher inflatio...
The Fed is not directing the markets, but indicators like this a...
The Fed is not directing markets, but the 2yr yield and indicators like this (credit spreads) most assuredly are...
slopechart_IWM,TLT.jpg
Bonds vs small caps
slopechart_TLT.jpg
STFB to the 21 EMA
The Inflation/Deflation debate wears on… | Notes From the Rabbit Hole
Is next phase inflationary or deflationary? The inverted right side shoulder or lack thereof will tell.
1
yield curve
No assurance that the yield curve steepener will remain inflationary. Nope, none at all.
tyx
Was today the low in the 30yr yield's right side shoulder? If so, get ready for a change in this week's tone. If n...
1
slopechart_TLT.jpg
TLT had it going for a month. Now it could take out 125 by Early June

Continuum to… Continue? | Notes From the Rabbit Hole
30yr yield is breaking a fl...
cpi & ppi
Screwing the consumer over decades is one thing, but let manufacturing costs (PPI) get out of hand and it's a whol...
30 year treasury yield
Recent pullback in yields was in the bag as Gross touted a bond short.
bfmFA55.jpg (1108×584)
slopechart_TLT.jpg
Major support almost reached on TLT.

1
slopechart_TLT.jpg
Still in a down trend

slopechart_TLT.jpg
Treasury yields in the tank
1
30 year treasury yield
The inflation is going to fail. The question is when?
5 year inflation rate
The inflation is going to fail. The question is when?
30Y net specs.jpg (1096×588)
Traders are really, really, REALLY short bonds right now.
yield curve
If you're gonna get the markets right you gotta get the macro right. Here's one such macro map needed.
slopechart_TLT.jpg
Resistance overhead
slopechart_TLT.jpg
Bounced off support
slopechart_TLT.jpg
Meandering
slopechart_TLT.jpg
Has been quietly chopping
slopechart_TLT.jpg
Weakness continues
slopechart_TLT.jpg
Looks like a bullish breakout to me. I see no reason 170 can't be attained.
slopechart_TLT.jpg
Headfake?

bfm361.jpg (976×508)
1
30yr 5yr yield curve
30yr-5yr yield curve did tw...
2
slopechart_MSFT.jpg
doug diamond april
Don’t try to (re) build Rome in a day | Notes From the Rabbit Hole
Words are necessary here. Deflation. That is a word. Inflation. that is another words. Remember it because it's no...
1
slopechart_TLT.jpg
Marching back up
A silly question on market sentiment… | Notes From the Rabbit Hole
Market sentiment is not risk averse or over bearish. Market sentiment is absolutely 100% TERRIFIED.
Stories from the bond market as the Yield Curve Steepens | Notes...
SPX finally cracks as TIP/TLT had foretold well before effing COVID effing 19. This is the lever.
tyx
Powell the effing dove was in the bag even before COVID-19, it's just that he's on steroids now.
Stories from the bond market as the Yield Curve Steepens | Notes...
Bonds are in full tank mode amid the deflationary rush by the herds... ha ha ha bring on the inflation.
yield curve
Yeah, just another steepening of the curve...
1
yield curve
Why I do believe we are witnessing a baby yield curve steepener...
Gold’s hidden affinity for Treasury bonds | Notes From the Rabbit Hole
A little reminder from the last deflation scare. This is an excerpt from 11/22/08.
tlt
Treasury bonds look like...
tyx
NIRP here we come!
TLT Trade of the Year and What Is Next! – Technical Traders Ltd.

yield curve
Yield curve steepens to highest point since the summer mini-inversion. Steepener currently deflationary, but can l...
yield curve
10/2 yield curve ticks back toward steepening.
1
yield curve
Yield curve flattening again. I don't expect the stock market to crack hard until it re-steepens. Then it could be...
Inflation (lack of) Expectations | Notes From the Rabbit Hole
Fed is out of its comfort box on the downside as it was on the upside in late 2018.
Inflation (lack of) Expectations | Notes From the Rabbit Hole
Inflation (lack of) expectations.
Inflation (lack of) Expectations | Notes From the Rabbit Hole
Inflation (lack of) expectations.
30 year treasury yield
The fix is in, unlike in Q4 2018... check the associated post for a big reason why bears are continually played by...
slopechart_TLT.jpg
Approaching ATH's
tnx
Say, GYX/Gold curiously going the 'wrong' way. Who's right, it or the 10yr and TIPs ratios? Answer is for all the...
tyx
I for one have to ask 'why?'. https://nftrh.com/2019/11/25/casino-patrons-turn-to-the-right/ Beep beep!
tyx
30yr yield still above the key 2.2% level. Still in-month, but this is the start a reflation trade would need.
Treasuries Pause Near Resistance Before The Next Rally – Technica...
1
slopechart_GDX.jpg
Who is the https://upload.wikimedia.org/wikipedia/en/thumb/f/f2/Biggest_Loser_logo.jpg/250px-Biggest_Loser_logo.jp...

slopechart_TLT.jpg
$TLT Interesting. $TRX?
Sorry to hear @Mully.
Follow these losers at your own RISK!
$TRX (See previous...
3
10-year...
crb
Commodity bubbles 1& 2 came against very elevated inflation expectations (TIP/TLT), which makes much sense.
crb
Commodity bubbles 1 & 2 came against a robotic decline in long-term yields, which makes little sense.
yield curve
Will this condition hold to close the week? If it does and if the yield curve steepens, better have a plan for an...
1
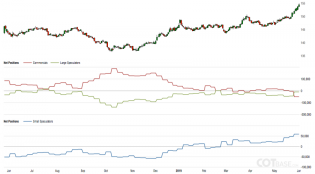
30 year bond cot
As for the long bond's CoT, the little guy (bottom panel) is as bullish now as he was bearish in Q4. Dat's un-bullish.
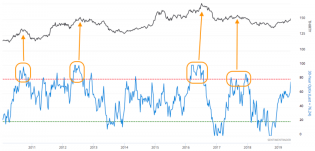
30 year bond optix
Public optimism rising on the long bond. Getting contrary bearish.