Browse Symbol Stacks: UNG
slopechart_UNG.jpg
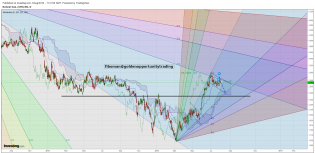
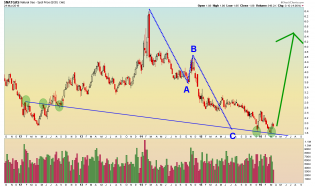
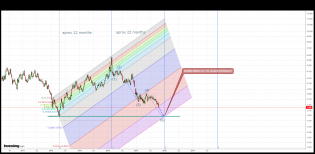
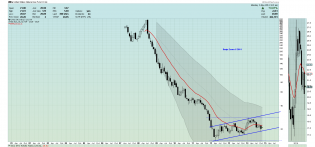
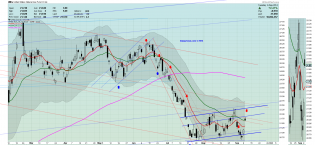
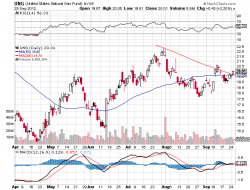
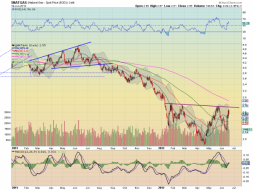
UNG - Bullish falling wedge breakout with positive divergence.

3
slopechart_UNG.jpg
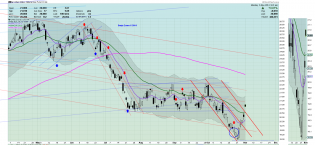
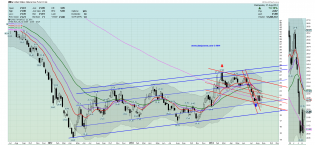
what a cluster...

1
slopechart_UNG.jpg
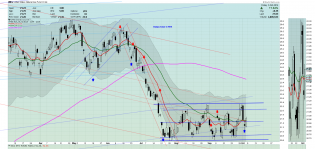
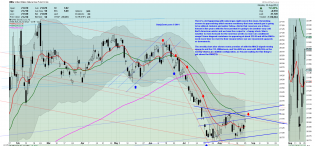
the cup floweth over
1
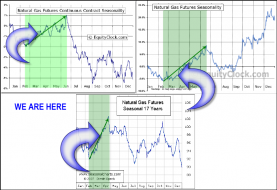
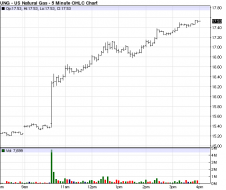
natural gas futures price
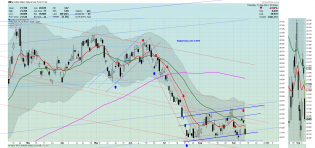
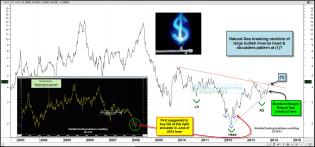
NatGas is falling apart, seasonal negative and "the last inflated man standing" (Energy) is in trouble.

Commodity tracker dunks below the SMA 200 – Notes From the Rabbit Hole
There goes CRB (commodities) tracker DBC, cracking the SMA 200 today.
slopechart_UNG.jpg
Nat Gas - It is going to be a long hard winter and what will the birdies do then the poor things they fly to the s...
slopechart_UNG.jpg
This is incredible! Really - we may see gas prices triple for nat gas. Which means that people will move the ele...
slopechart_UNG.jpg
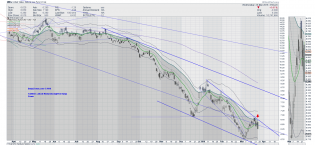
We're just about there, at the lower channel support.
slopechart_UNG.jpg
Approaching lower channel support
slopechart_UNG.jpg
Natty still strong. Signs of a cold winter in many places
slopechart_UNG.jpg
Cold winter ahead (solar minimum)
slopechart_UNG.jpg
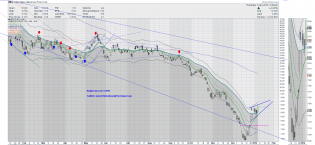
Good setup on UNG.
If it goes down to fill the gap, or anywhere close, so much the better. BTD.
1
slopechart_UNG.jpg
Will it find a bottom?
3
slopechart_UNG.jpg
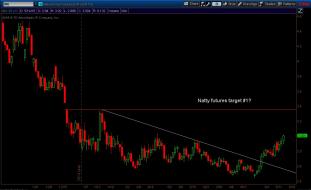
This instrument trades nothing like the futures. Take a look at Natural Gas futures and this chart.

1
slopechart_UNG.jpg
Trapped many up top
slopechart_UNG.jpg
Strong close
slopechart_UNG.jpg
Natty Gas breaks out
natural gas
As NatGas breaks to a new low today it's either a massive opportunity or a complete disaster. Generational lows.
3
Energy Sector Reaches Key Low Point – Start Looking For The Ne...

Natural Gas Sets Up Bottom Pattern – Technical Traders Ltd.
US Stock Market Setting Up A Pennant Formation – Technical Trader...
Natural Gas Moves Into Basing Zone – Technical Traders Ltd.
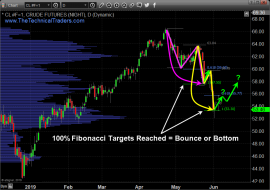
Fibonacci Support May Signal Bounce in Oil & Equities – Technical...
1
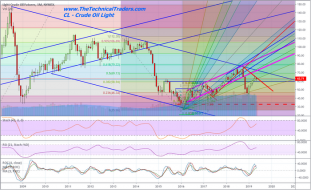
Oil, Hot Stocks, and Currencies – Part III – Technical Traders Ltd.
2
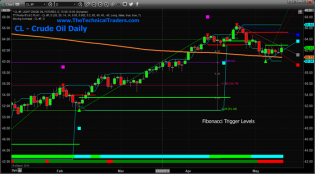
Crude Oil Fails At Critical Fibonacci Level – Technical Traders Ltd.
Natural Gas Sets Up Another Buy Opportunity – Technical Traders Ltd.
Natural Gas Bottoming Again
1
ng 03.08.16.png

2
Natural_D.png
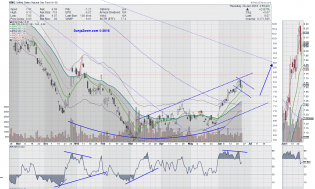
Natural Gas ETF (UNG) appears to be putting in a cap and handle pattern. I think, although I am not sure, we are c...

Natural Gas - Daily - 5.17.16.png
Natural Gas daily. This is not investment advice.

2
Natural Gas - Weekly - 3.24.2016.png
Natural gas - weekly. A generational bottom for this commodity is probably in with the recent swing low. This is n...
3
UNG_D.png
Great short right now but be careful as a bullish declining wedge seems to have developed with a breakout maybe ha...
1

UNG - Daily - 3.1.16.png
UNG daily. This is not investment advice.
4

Natural Gas - Daily 2.25.2016.png
Natural Gas daily chart.
Natural.png
Second retracement wave of natural gas seems to be going in. Sorry, but I think UNG is headed towards the gap $8.0...
UNG.png
I was a little early in calling a short on Natural Gas. It's rise has been impressive, but sometime over the next...
nat gas1.png
Nat gas
1
Natural_D.png
Natural Gas (UNG) is looking fantastic right now. EMA's are poised to crossover with a large ascending channel app...
2
NG_Daily_May142015.jpg
Natty finally in bull mode heading into Summer swelter season.
We have break and hold above downtrend line off...

gld.slv
Gold-Silver ratio and USD rallied together out of summer and croaked commodities. If they correct together (even...
UNG_M.png
On the monthly chart UNG made a nice tap at the lower support line month, a fact I am only just noticing. With hea...
UNG_D.png
Heating season has begun and the EIA recently reported that the next two weeks will see an above average number of...
gas.png
Natural gas's continuation pattern didn't break down like I thought it might and instead continued chugging along....
2
UNG.png
Remember I described my confusion at UNG breaking down from the continuation pattern only to turn back up. Well, I...
UNG.png
As usual I called a "short/sell" on natural gas a little early when it broke below $21.00 and then bounced back. B...
UNG.png
Weekly Chart: Another bottoming pattern being put in. Harvest season is here with autumn and winter approaching. A...
UNG.png
2
natgasnecklinebreakoutdec12.jpg (1568×735)
Bullish Neckline breakout of multi-year head & shoulders for natural gas

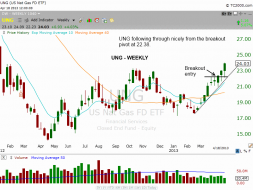
$UNG WEEKLY chart
Stock Market Breaks Down, As Two Of Our Swing Trades Breakout. This article is technical analysis of the current s...

2
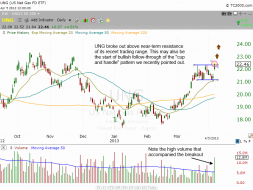
Technical pattern of UNG
US Natural Gas Fund ($UNG) breaking out and following through with its bullish "cup and handle" pattern identified...
4
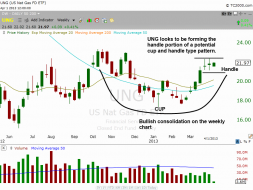
$UNG weekly chart
How To Trade The Cup And Handle Chart Pattern For Maximum Profit
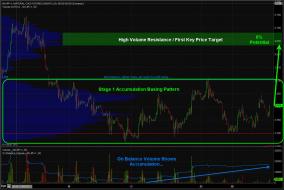
ChrisVermeulen - $NG_F is forming a Stage 1 Accumulation Basing...
Natural Gas forming a bottom here
ungtistheseasondec19.gif (1575×728)
The Power of the Pattern suggested on Thanksgiving it was time to harvest/Sell Natural Gas due to its strong gains...
1
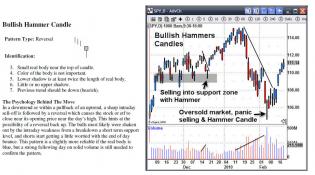
http://www.thegoldandoilguy.com/goldcharts/BullishCandle.jpg
naturalgasdoesntstinknov22.gif (1575×727)
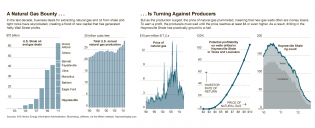
A Natural Gas Bounty Is Turning Against Producers - NYTimes.com
A Natural Gas Bounty Is Turning Against Producers
UNG
MA crossover, Target around 21


Natural Gas Infographic
Natural gas infographic
UNG July 30.jpg
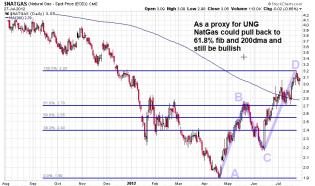
As a proxy for UNG - $NatGas could pull back to 61.8% fib and 200dma and still be bullish

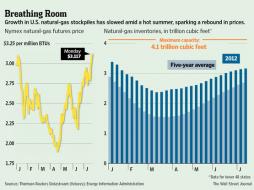
MI-BQ210_MKTLED_G_20120723175712.jpg (555×414)
Natural gas stockpiles
Nexen NXY

natgas d

http://etfdb.com/wp-content/uploads/2012/06/UNG3.png

Capital Destruction in Natural Gas | ZeroHedge
Interesting drop-off in natural gas production
1