Browse Symbol Stacks: $USD: $USD 9.15.13sc.png
$USD 9.15.13sc.png
The pattern of the US dollar ($USD) has been confusing to me for quite a while but in looking at it this morning it really looks now like a classic 5 wave triangle. This often occurs after large major moves up or down. Most often when the triangle is complete there is another quick moving action in the same direction the equity was moving in before the triangle started. In this case it implies the next major move in the dollar is down. The target from the triangle would be around 63.
Many other equities of course are influenced by the value of the dollar. Correlations of course are not perfect. On this chart I am suggesting the possible moves of oil, metals, and bonds. I have previously put up charts of TLT and $SILVER which for other technical reasons lead me to believe the next major move in these two is up. I have no suggestion for what this will do major stock indices. Notice since 4/2011 the SPX has been going up while the dollar is rising unlike earlier years. It seems possible to me that a rapi
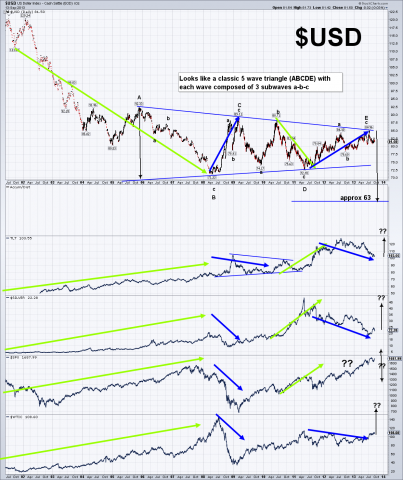


Many other equities of course are influenced by the value of the dollar. Correlations of course are not perfect. On this chart I am suggesting the possible moves of oil, metals, and bonds. I have previously put up charts of TLT and $SILVER which for other technical reasons lead me to believe the next major move in these two is up. I have no suggestion for what this will do major stock indices. Notice since 4/2011 the SPX has been going up while the dollar is rising unlike earlier years. It seems possible to me that a rapidly falling dollar could possibly lead to great fear and start a big selloff but I really have no idea. Like always we just have to patiently wait and see.
Hope this in some way is helpful to you. Have a happy and productive week trading. Tom 9/15/13