Browse Symbol Stacks: $USD: $USD daily 4.11.14.png
$USD daily 4.11.14.png
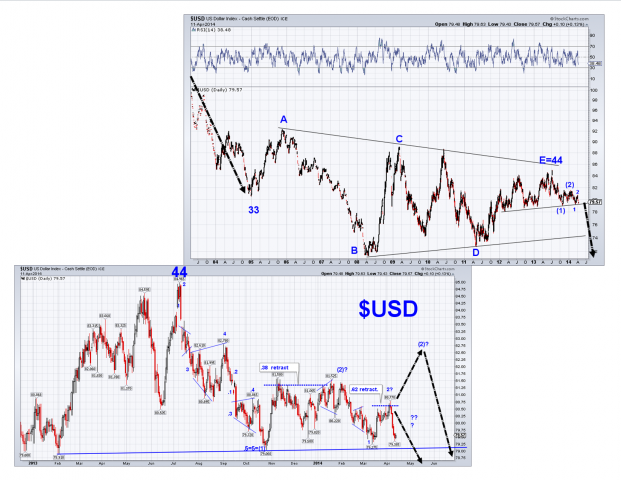
US Dollar daily: Since I am interested in precious metals I follow the US dollar which is one influence on the price of the metals. The upper chart is a long term chart which shows a 5 wave triangle. When this occurs after a steep fall in price as is the case here, it usually leads to one more 5 wave drop down. I think wave one down is likely over but not sure if wave 2 is done. If it is we will see a rapid drop down soon. I"m keeping an eye on the almost horizontal support line starting in February 2013. Have a great Sunday. Tom B
Comments
No comments yet.


