Browse Symbol Stacks: $UTIL
slopechart_$UTIL.jpg
Pretty good fight over this horizontal at channel support.

slopechart_$UTIL.jpg
Bearish horizontal failure. Will the channel hold?
slopechart_$UTIL.jpg
$UTIL - to remain bullish monthly chart must close over the 2019 high. Long way until the end of the month, but n...

1
slopechart_$UTIL.jpg
Utilities Index tap 38% retracement and might pop higher in the never-ending quest for yield.

1
slopechart_$UTIL.jpg
Not looking good for utilities. Almost broke out but then lost 2 horizontal supports.
2
slopechart_$UTIL.jpg
Is there a time limit on rising wedges? Are they like twinkies? Or did this one expire already?

slopechart_$UTIL.jpg
Ok, try it again
1
slopechart_$UTIL.jpg
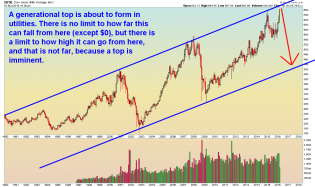
Widows and Orphans Utilities: My target area is based on Minimum Fib retracements of 61.8% from prior bear market...
1
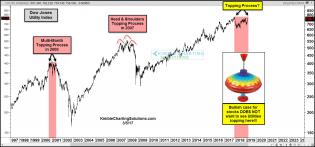
utilities-could-be-creating-a-topping-pattern-march-5-2.jpg (1569×733)

slopechart_$UTIL.jpg
Best news this week was the trendline breach of the Dow Utilities
2
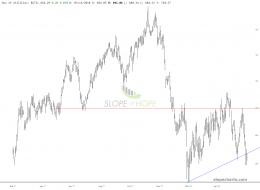
$UTIL - Daily - 8.3.16.png
Utilities - daily. This is not investment advice.

1
$UTIL - Monthly - 3.18.16.png
Utilities - monthly chart. This is not investment advice.
6
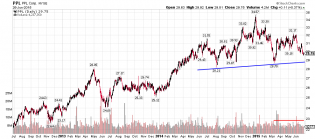
ppl.png

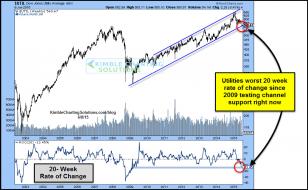
util2009support20weekrateofchangejune9.jpg (1034×636)
Dow Utilities looking sick
2
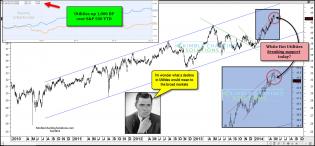
xlubreakssupportmay2.jpg (1571×733)
Defensive White hot sector (Utilities) breaking support today?
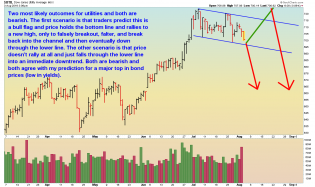
utilitieslosingpowernov51.gif (1575×728)
Utilities are “Losing Power” – will it spill over into the broad markets?