Browse Symbol Stacks: WHEAT: wheat.png
wheat.png
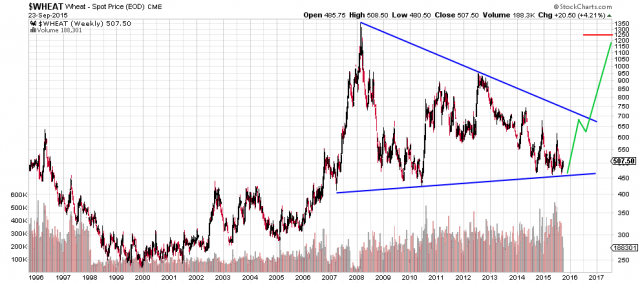
Wheat long term chart is a symmetrical triangle. If this is true then much higher prices are in store for this commodity over the next few years. ETF for this one is WEAT.
Comments
No comments yet.
Wheat long term chart is a symmetrical triangle. If this is true then much higher prices are in store for this commodity over the next few years. ETF for this one is WEAT.
No comments yet.


