Browse Symbol Stacks: XLE
slopechart_XLE.jpg
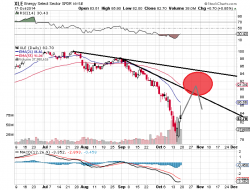
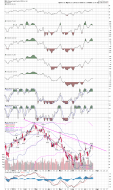
XLE - a bearish rising wedge months in the making, coupled with last Friday's bearish harami weekly candle.

1
slopechart_XLE.jpg
breakout in XLE

slopechart_XLE.jpg
nice breakout today, but not confirmed by volume
headfake or preview?
slopechart_XLE.jpg
pushing at the upper level
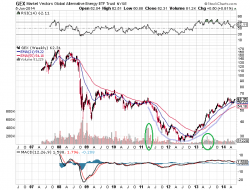
xop/xle ratio of energy sector internals
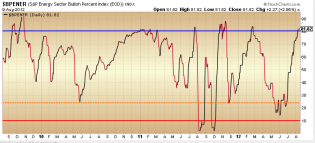
If you believe in this internal indicator (XOP/XLE ratio) and you're an Energy bull, 'ruh roh!' might be the appropri...

natural gas futures price
NatGas is falling apart, seasonal negative and "the last inflated man standing" (Energy) is in trouble.
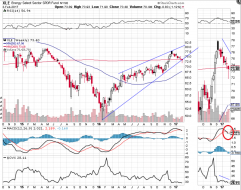
XLE, energy sector (oil and gas)
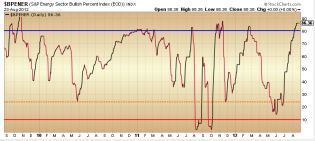
Energy sector froggies in a pot that will oh so slowly come to a boil (disclosure: short Energy).
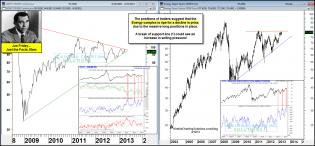
‘Last inflated man standing’ needs a crutch – Notes From t...
"Last inflated man standing" may be joining the bear fest.
slopechart_XLE.jpg
just a little bit left to go to top of Q channel -

1
slopechart_XLE.jpg
Could it be a failed bullish break-out, currently on the line? Looking for failure today to go short. Also, extremely...
3
slopechart_XLE.jpg
XLE at $56.95 range key level. Above bullish, below bearish. Looking at McL Osc we may have turned the corner up.
slopechart_XLE.jpg
Trendline down from 11/08 holding. Yesterday's high $58.59. My line in the sand at $58.47 of by 0.12 cents. Tou...
1
slopechart_XLE.jpg
58.47 is my line in the sand for XLE. McLennan Osc in...
slopechart_XLE.jpg
XLE EMA 9 about to break thru EMA 30. Bullish
1
slopechart_XLE.jpg
May buy it lower

slopechart_XLE.jpg
A Slope Virtual Trade
slopechart_XLE.jpg
Has a long way to go
1
slopechart_XLE.jpg
Will it ever get going?
slopechart_XLE.jpg
Moving Averages are pinching
slopechart_XLE.jpg
The REV says this moves higher through October
1
natural gas
As NatGas breaks to a new low today it's either a massive opportunity or a complete disaster. Generational lows.
3
slopechart_XLE.jpg
Energy on edge

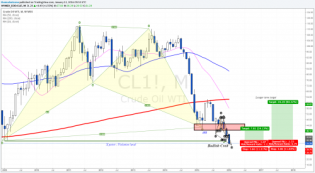
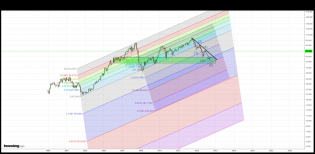
Crude Oil Breaks Down – Target $40 – Technical Traders Ltd.

6
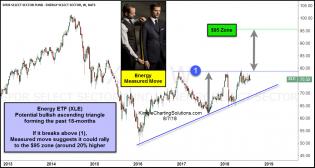
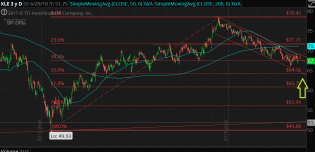
xle-measure-move-suggest-20-percent-gain-aug-7.jpg (1236×661)

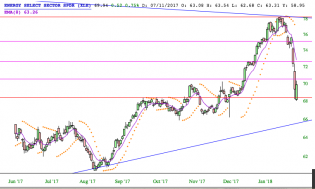
Screen Shot 2018-02-06 at 6.07.42 PM.png
$XLE $OIH /cl
http://slopeofhope.com/2018/02/complete-boffo-loser.html
Tim are your referring to POTUS, Sen...
4

0054B4FC-1382-4830-B7D2-74D068E9183D.jpeg
If your play in this space (@PipeSticks) /cl daily and monthly may be something to look at.
https://www.investing...

14

unnamed.png.jpg (786×542)
@Pipes don't worry about $BP Trump has their back.
Drill baby drill. A little leaking 'butt' is good for the e...
14
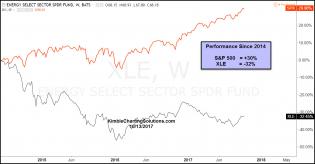
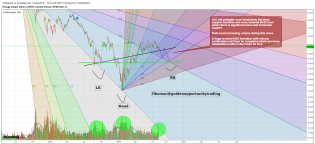
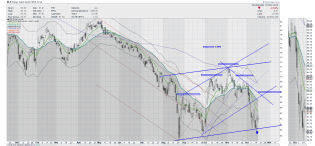
xle-spy-performance-since-2014.jpg (1293×675)
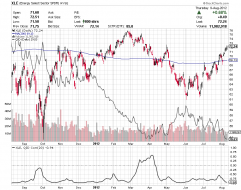
Energy ETF (XLE) has lagged the S&P 500 by a large margin over the past three years, reflected in the chart below-
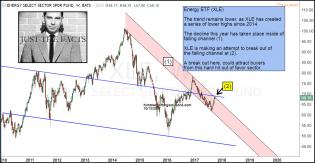
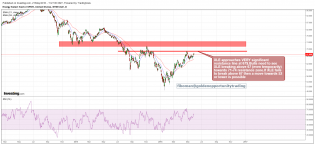
xle-testing-key-breakout-level-oct-13-1.jpg (1295×672)
Could this large underperformance turn into an opportunity? Sure could! Check out the key test that is in play with XLE.
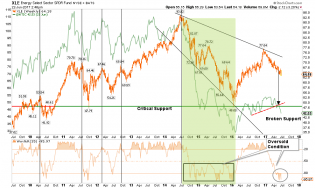
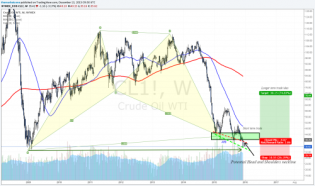
Oil-WTIC-XLE-062217.png (990×591)
Since then energy stocks have continued to deteriorate and oil prices have now broken important support. The next...
XLEtarget.png
50% retracement from 1/20/16 low on XLE to 12/12/16 high is also the bottom of the latest bear trendline on the daily.

1
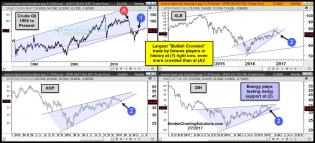
crude-oil-testing-resistance-as-most-bullish-crowded-trade-in-histo...
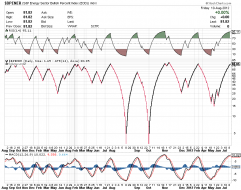
Crude oil - most crowded bull trade in history
2
3 feb4.PNG
XLE warning for what's coming?
...Or are oil traders right? (OVX is oil volatility)

1
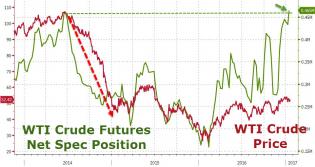
20170122_oil1.jpg (961×510)
The Last Time Oil Speculators Were This 'Long', Crude Collapsed
5

oil-sector-working-on-neckling-breakouts-dec-12.jpg (1568×704)
Energy sector breakout
1
5 sept27.PNG
Energy sector didn't buy the oil bounce yesterday
XLE 04.08.16.png
XLE Huge Inverted H&S

4
2 jul25.PNG
3
xle (1) 27.05.16.png
XLE make it or break it or the 67$ level
1
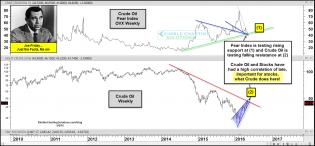
joefridaycrudetestingresistefearonsupportmay6.jpg (1572×732)
Crude oil at an important crossroads
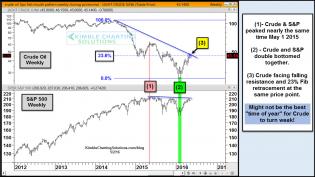
crude-oil-spx-facing-falling-resistance-first-of-may-may-2.jpg (...
Sell in May for crude oil
image
Oil in focus as Doha's meeting takes place in Qatar - The Weekly Markets Analysis

XLE 20.02.16.png
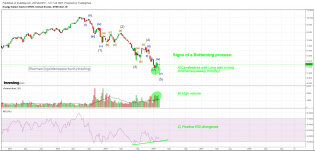
Energy Sector Equities (XLE): A buying opportunity
9
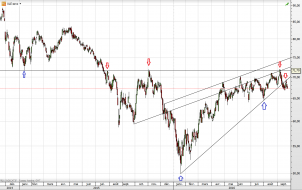
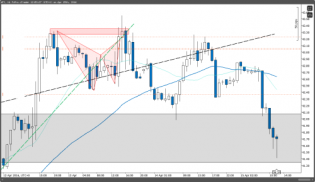
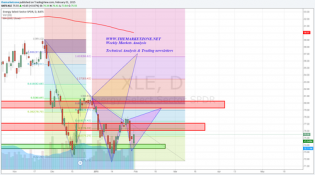
Update - Monthly pattern challenged, daily Crab... • The Market Zone
Monthly harmonic pattern challenged
Energy.png
It's weird but I think a double head and shoulders pattern may be developing in energy too. The final shoulder has...

2
Janet Yellen and the Fed in focus - Fed’s week... • The Market Zone
Oil prices drove markets lower as $SPX about to re-test 2000. Harmonic pattern still valid but its fate will be de...
xle4.png
XLE heading lower
3
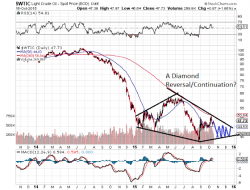
sc376.png
Oil is probably forming a diamond: Reversal or Continuation?
3
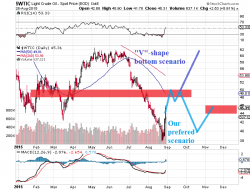
sc348.png
Are better days coming for oil? 2 possible scenarios.
2
The Market Zone — The Weekly Markets Analysis - 1/2/2015
XLE harmonic trading ideas in this week's Weekly Markets Analysis - http://marketzone.tumblr.com/post/109781553115/th...
1
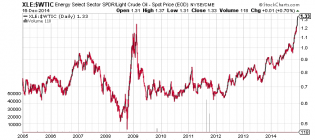
xlewtic20141217.png
Long crude, short oil stocks?

1
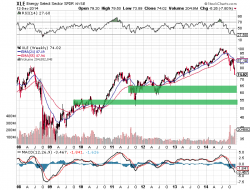
sc245.png
Energy stocks:Death cross
2
sc215.png
XLE:Short term bounce to 90+/-2
2
sc (92).png
Cup (and handle?) alt-energy=Peak cheap oil?
1
joefridaycrudexleripefordeclineapr12.jpg (1563×726)
Crude oil has formed a multi-year pennant pattern and Energy ETF (XLE) is up against resistance. Traders now have...
ener.png (778×350)
load the boat short with this at 86% - longs don't even need to be seriously considered until this is below 50%

$BPENER
RENKO CHART (first time using this type)

XLE
my energy hedge
Forming a Major Top
2
BT''s Timing Board (SPX AND TIMING): XLE near a trend change

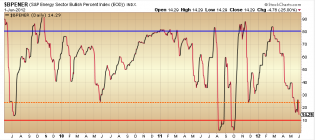
energy.png (777×347)
1