Browse Symbol Stacks: XLK
slopechart_XLK.jpg
Hi tech; bye-bye tech.
XLK

1
slopechart_XLK.jpg
Quite the candle trio on the yearly chart of XLK.
2
slopechart_XLK.jpg
XLK - Lines that matter.
1
slopechart_XLK.jpg
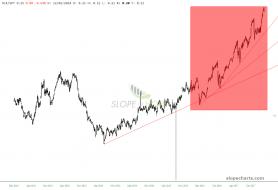
XLK channel

slopechart_XLK.jpg
XLK - Purple reigns.
slopechart_XLK.jpg
XLK hasn't really taken a beating yet. In fact it just tapped against resistance yesterday (11/22). Over 50% of...

slopechart_XLK.jpg
The heaviest weight sector

slopechart_XLK.jpg
The Beefiest sector and best to watch at times of bullish or bearish times
2019-01-30_8-59-56.jpg (890×442)
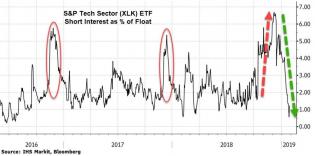
Short interest in tech has collapsed

slopechart_XLK_SPY.jpg
XLK vs SPY. A very volatile relationship with spikes of outperformance followed by sharp reversals over the past t...

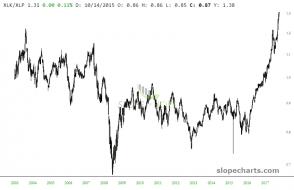
slopechart_XLK_XLP.jpg
XLK/XLP ratio chart.
Politics and Macro Economics – TheMarketZone
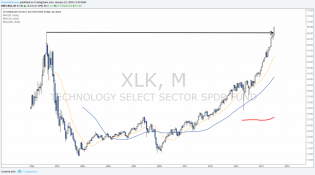
XLK takes out the 2000's tech bubble top

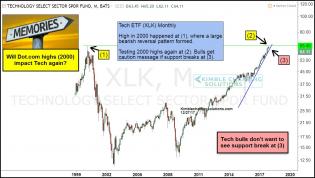
tech-etf-xlk-have-a-memory-at-2000-highs-dec-27.jpg (1190×674)
Tech bulls want this level to be forgotten!
1
weekly markets analysis
Bearish harmonic patterns in two sectors. What it means for SPX?
1
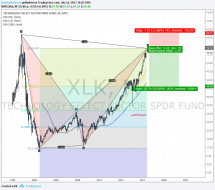
Tech.png
Massive ascending bearish wedge with a smaller condensing triangle. I wonder which way the condensing triangle wil...

1
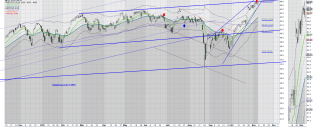
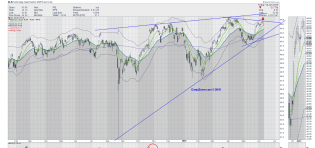
Technology.png
This struck me as an excellent speculative short/sell that was simply too good to pass up. Now a bearish ascending...
1
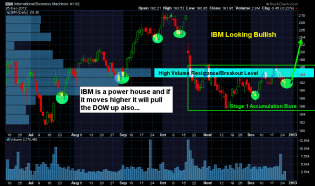
ChrisVermeulen - $IBM Stage 1 Basing Pattern - Get ready for a r...
IBM building Stage 1 Accumulation base and is 13% of DOW Jones Average

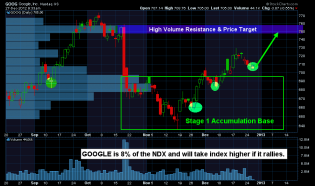
ChrisVermeulen - $GOOG broke out of Stage 1 Base and in New Mini...
Google setting up for another rally, this is 8% of NDX so expect nasdaq and tech stocks to rally.
1
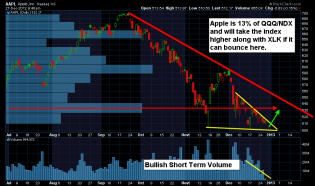
ChrisVermeulen - $AAPL showing bullish volume and price pattern...
Apple shares set to breakout and pop soon, expect higher NDX index to get dragged higher