Log In
|
Create Account
Chart
Chart Lab
Drawn Objects ➟
Earnings Reactions
Guide to Patterns ➟
Modes ➟
Power Features ➟
Rotation Graphs
SlopeCharts
Videos for SlopeCharts
Yield Curve
Equities
Biggest Stocks
Calendar of Earnings
Correlations
Earnings ➟
Historical Earnings
Market Capitalization
Power Screener
Super Summary
Volume/Price Leaders
Woulda Shoulda
Markets
Automatic Reports
Commodities
CryptoStream LIVE
Economic Database
Global Economics
Macroeconomics
Market Meter
MetaSymbols
Quad Matrix
SlopeRules
Options
Analytics ➟
Backtest Strategies
Earnings Calendar
Extreme Options
Historical Charts
Matrix of Volatility
Open Interest & Volume
Payoff Analyzer
Strategy Explorer
Volatility Calendar
Read
Best Posts of All Time
Books by Tim Knight
Comments Search
Guide to Comments
Latest Posts
Mobile Apps
Profile of Your Host
Recommended Books
Ticker Stripper
Trading Rules
Social
Activity Feed
Browse Chart Database
Hall of Fame
Members Directory
Publishing/Subscribing
Recent Activity
Search SlopeRules
Shared Labels & Lists
SlopeTalk LIVE
Trader’s Diary
Help
Best Pages for You
Charts Overview
Guide to the Site
Membership Levels
Pattern Video Library
Power Screener Guide
Premium Memberships
SlopeCharts Reference
Using SlopeTalk Chat
Video Tutorial
Log In
Create Free Account
Memberships
Browse
Symbol Stacks
: XLV
slopechart_XLV.jpg
Closed my dog of a paper put on $XLV while the getting was good. +30%
slopechart_XLV.jpg
Peter pointed out the Diamond on XLV
slopechart_XLV.jpg
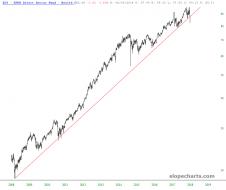
$XLV I had the same long-term trendline, except that I bypassed the 2020 dip.
slopechart_XLV.jpg
Oops
1
slopechart_XLV.jpg
Frothy
When a relatively ‘defensive’ sector is doing this… – Notes...
Even more disgusting than nominal XLV is the XLV/SPY ratio, because this ratio rises in bear market and if it gets...
When a relatively ‘defensive’ sector is doing this… – Notes...
Want to see a disgusting chart?
slopechart_XLV.jpg
Rising getting sharper
slopechart_XLV.jpg
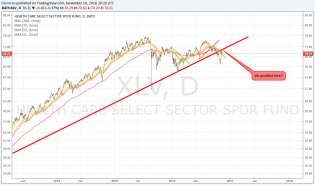
Double top and channel failure.Waiting for the bounce to short.
vs. SPY | Notes From the Rabbit Hole
Healthcare vs. SPY.
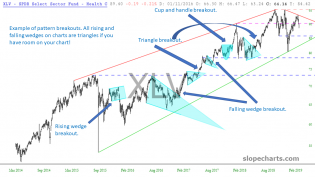
SLVpatternbreakouts.png
More chart art showing pattern breakouts in XLV.
slopechart_XLV.jpg
Healthcare got weak this week
2
xlv 16.11.16.png
1
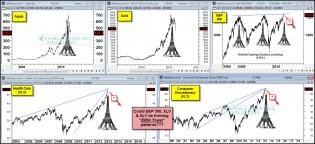
eifffel5packapr17.jpg (1563×716)
Eiffel Tower patterns could be forming in these investments…35%+ decline possible!
1
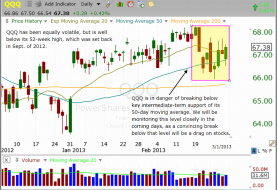
Technical pattern of stock - $QQQ DAILY
Who Will Win The Present Tug Of War Between The Bulls And Bears?