Log In
|
Create Account
Chart
Chart Lab
Drawn Objects ➟
Earnings Reactions
Guide to Patterns ➟
Modes ➟
Power Features ➟
Rotation Graphs
SlopeCharts
Video Guide to SlopeCharts
Yield Curve
Equities
Biggest Stocks
Correlations
Earnings ➟
Historical Earnings
Market Cap Charts
Power Screener
SlopeMatrix
Super Summary
Today’s Movers
Woulda Shoulda
Markets
Commodities
CryptoStream LIVE
Economic Database
End-of-Day Report
Global Economic Charts
Macroeconomics
Market Meter
MetaSymbols
Quad Matrix
SlopeRules
Options
Analytics ➟
Backtest Strategies
Calendar
Charts for OI & Volume
Extreme Options
Options Charts
Payoff Analyzer
Strategy Explorer
Trading Strategies
Volatility Matrix
Read
Best Posts of All Time
Books by Tim Knight
Comments Search
Guide to Comments
Latest Posts
Mobile Apps
Profile of Your Host
Recommended Books
Symbol Stripper
Trading Rules
Social
Activity Feed
Browse Chart Database
Guide to SocialTrade
Hall of Fame
Members Directory
Publishing/Subscribing
Recent Activity
Search SlopeRules
Shared Labels & Lists
SlopeTalk LIVE
Help
Best Pages For You
Custom Tiles Guide
Guide to the Site
Membership Levels
Pattern Video Library
Power Screener Guide
SlopeCharts Reference
SlopeRules System Builder
Using SlopeTalk
Video Guide to Slope
Log In
Create Free Account
Memberships
Browse
Symbol Stacks
: $XOI
slopechart_$XOI.jpg
1
slopechart_$XOI.jpg
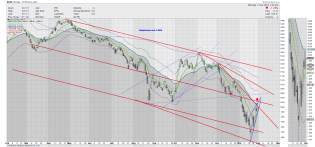
Gap filled. Mission accomplished? Or will it try for more?
slopechart_$XOI.jpg
I'm expecting a run up to the bottom of the preceding arc if the triangle breaks to the upside.
slopechart_$XOI.jpg
Oil Index drops back to the down trendline
slopechart_$XOI.jpg
Oil Index on edge
$XOI.png
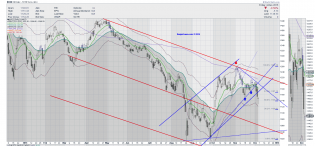
Bearish ascending wedge makes me think this rise in energy is due for a correction, what with rig counts being ext...
$XOI.png
I made a terrible bullish call about ten days ago on Energy. a vote by the United Kingdom for air-strikes coupled...
XOI.png
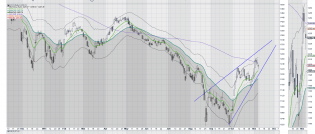
Earlier on Tuesday I also mentioned the bearish rising wedge in the Oil Index ($XOI) where this past week resistan...
1