User: Tim Knight: Favorites
aug sept seasonals.jpg (1128×709)
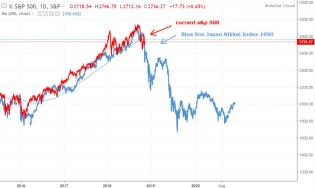
Seasonality isn’t your friend from now til mid-September

1
retail expectations DB.png (1280×723)
Consumers Have Never Felt So Optimistic About The Stock Market
3
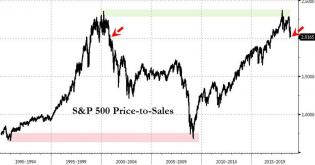
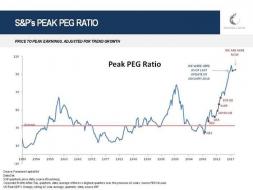
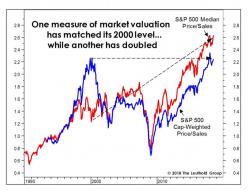
stat expensive spx.jpg (1026×528)
1
bfmA5E8_0.jpg (976×515)
0 (2)_1.png (1280×605)
101-yrs-7.5-trendline-5-13-20.png (1280×720)
2
history of asset bubbles.jpg (1140×751)
EMt8axYX0AExde2 (2134×1152)
Market-cap-GDP.png (768×573)
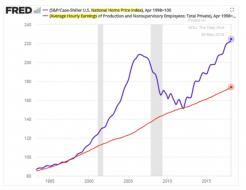
the best bull market.1573743376642.png (765×445)
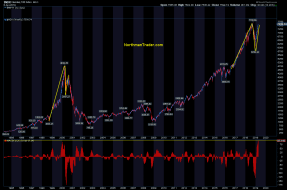
As of today, this is the largest, and longest, bull market in human history.
2
2019 vs 2007 morgan stanley.png (859×1069)
1
How-Much-American-Debt-Bubble.png (953×446)
business cycle length record_1.jpg (1280×838)
We are in the longest business expansion in history
NY-Fed-Prob-of-Recession-Chart.jpg (1114×551)
1
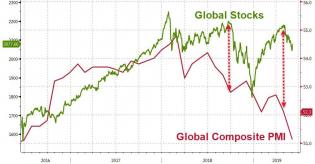
Global PMI.jpg (976×510)
topping-1.png (768×686)
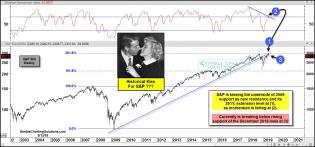
spy-historical-kiss-of-resistance-at-261-fib-level-may-13.jpg (1...
1
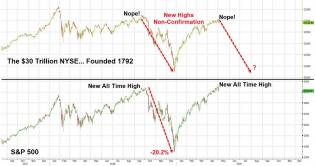
bfmCEB1.jpg (1280×677)
Non-confirmation high
citi-4.jpg (768×576)
NDXW-1.png (1240×819)
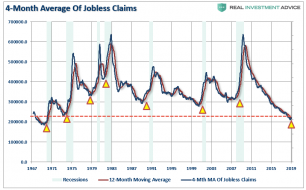
Jobless-Claims-Continued-4wk-Avg-021119.png (814×504)

Yield-Curve-10-2-021119 (1).png (890×462)
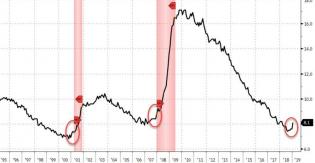
2019-02-22_8-02-50.jpg (890×463)
According to Lavorgna, since 1948, the economy has always entered or been in a recession when the unemployment rat...
1
2019-02-08_10-32-24.jpg (890×461)
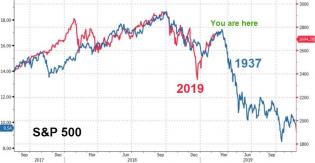
1937 analog
6
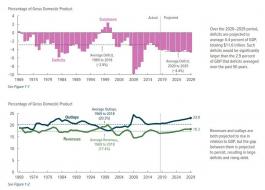
CBO jan 2019.jpg (883×633)
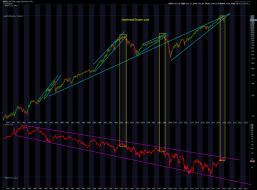
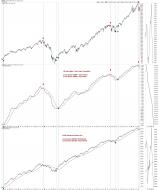
SPXM-5.png (1200×887)
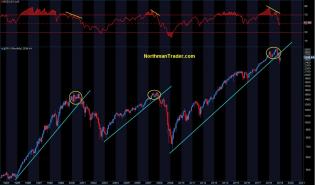
DwotrTmWkAADtkW.jpg (1200×708)
5-...
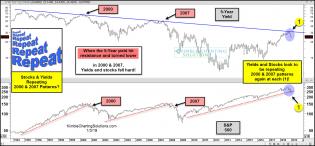
Bonds and Stocks repeating past behavior
1
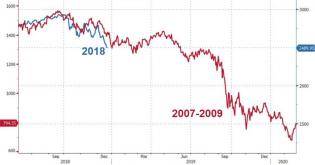
2008 vs 2018.jpg (890×469)
Incidentally, if this dire analog is accurate, the S&P should halt its decline somewhere around 1,500.
1
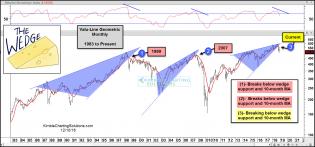
valu-line-geometric-wedge-attepting-breakdown-dec-10-5.jpg (1568×732)
1
DuKc6APXgAA3pXB.jpg:large (1715×2043)
Doom-Porn from Atilla
2
2018-12-10_12-33-44.jpg (890×467)
3
2018-11-20_12-48-52.jpg (890×468)
You. Are. Here.
2018-11-20_12-54-09.jpg (890×466)
This is one of the most beautiful ratio charts I've ever seen.
1
zp2r3ijmw2z11.png (1433×783)
DsJ0l8HUwAAUHd4.jpg+large.jpg (1149×689)
Pretty damned spiffy
1
2018-11-12_17-21-55.png (890×464)
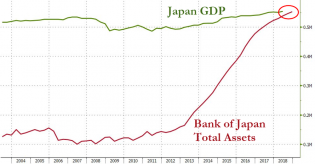
Bank Of Japan Total Assets Surpass Japan's GDP
5
gs bear 7.jpg (667×495)

stock-yield-ratio-testing-36-year-rising-support-oct-24-1.jpg (1...
1
2018-10-24_10-51-27.jpg (890×467)
Smart money evacuation
1
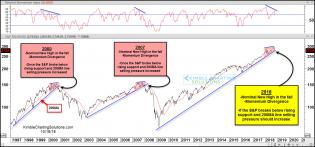
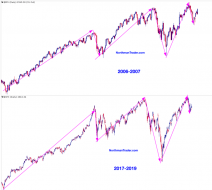
spx-reapting-2000-and-20007-pattern-testing-key-support-oct-19.j...
2
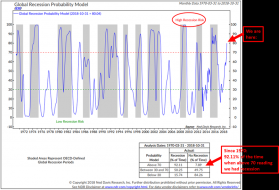
recession-.png (890×604)
Recession riska
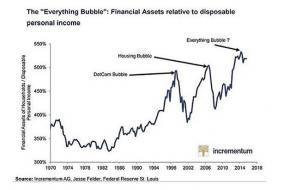
Bubble-of-everything.jpg (615×411)
2

stock-bond-ratio-could-be-forming-topping-pattern-oct-8.jpg (1234×658)
2
2018-10-05_13-36-08.jpg (890×474)
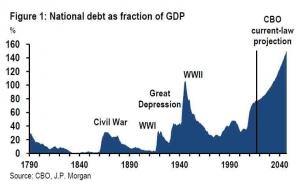
jpm debt cbo forecast_1.jpg (763×481)
We are so screwed
8
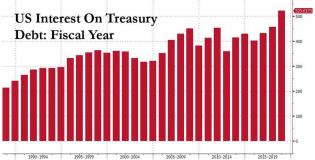
US interest on fiscal debt.jpg (890×453)
As the market's attention gradually turns to rising rates and interest expense, one number that will stick out is...
2
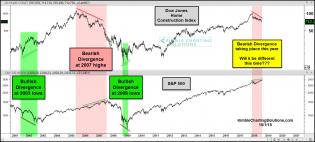
home-construction-spy-divergences-oct-2.jpg (1568×707)
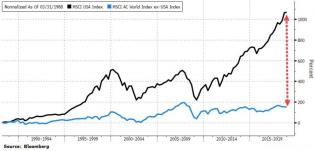
2018-10-04_10-19-44.jpg (890×428)
Finally we note that the divergence between the US and the rest of the world is now at a 30 year high...
fas bubble1.jpg (704×528)
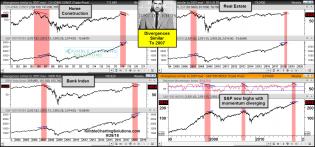
joe-friday-divergences-similar-to-2007-sept-28.jpg (1567×735)
2007 and 2018
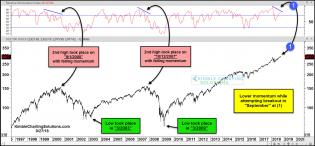
spx-hitting-new-high-with-lower-momentum-with-peaks-near-the-fall-e...
1
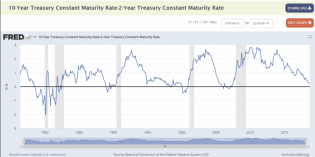
treasury_10-2_year.png (768×384)
2018-09-21_12-43-56.jpg (545×472)
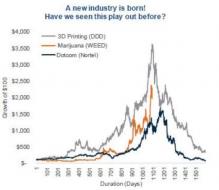
CHART: Beautiful analog of how marijuana stocks are going to go to pot.
1
2018-09-18_6-10-56.jpg (674×491)
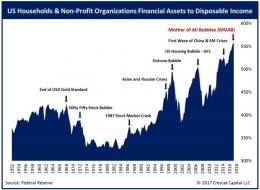
The mother of all bubbles (MOAB)
2018-09-18_6-18-21.jpg (662×501)
2018-09-18_10-31-03.jpg (890×452)
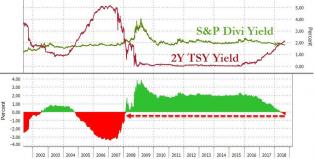
You will now earn more on a risk-free 2-year Treasury than you will from the S&P 500 dividends.
2
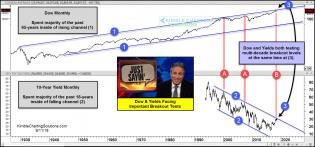
dow-and-yields-testing-multi-decade-breakout-tests-sept-11-1.jpg...
2018-09-05_8-18-32.jpg (890×467)
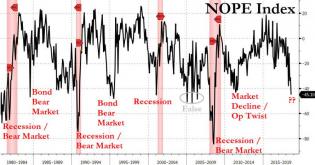
The spread between New Orders and Prices is the so-called NOPE Index, and as Leuthold Group notes, a drop below -4...
1
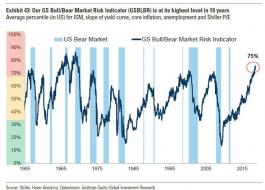
Goldman crash indicator.jpg (662×473)
2
2018-08-22_12-19-44.jpg (890×451)
2
2018-08-22_12-13-17.jpg (890×468)
2018-08-21-bull-market-fallback.png (890×628)
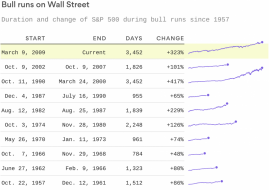
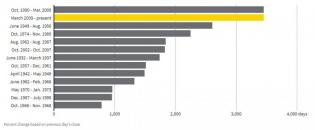
Longest bull run in history
2
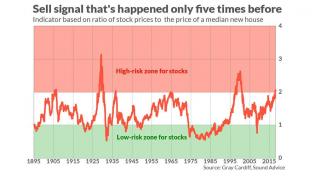
MW-GO608_sell_s_20180820153307_ZH.jpg (890×501)
The Stock Market's Latest Sell Signal Has Happened Only 5 Previous Times Since 1895
bull 1.jpg (890×369)
Longest bull market in human history.
Fuck. Me.
1
2018-08-21_9-20-46.jpg (845×509)
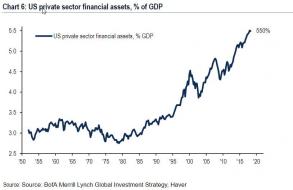
financial assets as % of GDP.jpg (814×527)
David Stockman: The World Economy Is At An Epochal Pivot | Zero Hedge
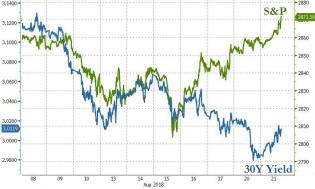
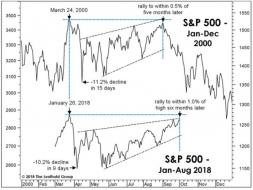
Analog between 2000 and 2018 peaks
1
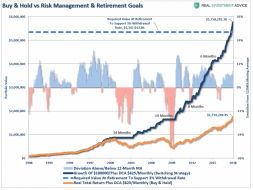
SP500-12MMA-Switch-100000-Investment-053018_0.png (890×668)
MW-GO008_Leutho_20180808145702_NS.jpg (890×679)
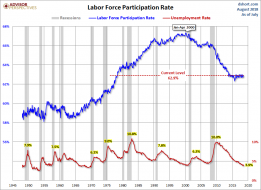
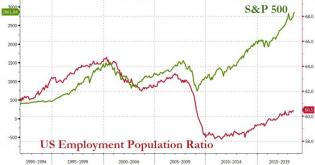
LFPR
D9DSxjET-1024x605.png (890×526)
1937/2018 analog - - quite extraordinary.
1
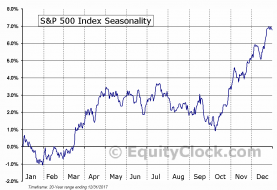
SP500-seasonal.png (911×623)
S&P 500 seasonality
2
2018-07-13_12-53-13.jpg (890×468)
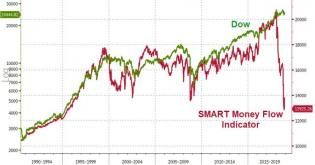
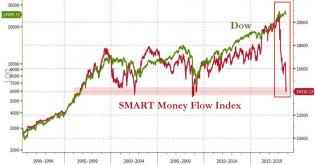
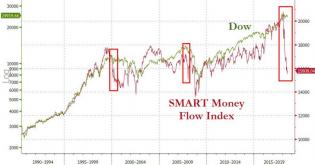
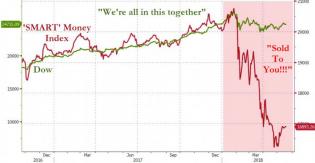
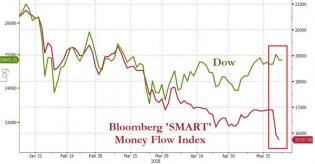
I wonder when the SMART money will seem really smart?
1
2018-06-28_14-33-44_0.jpg (890×474)
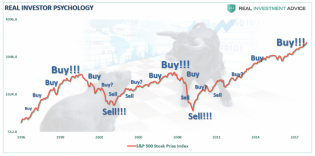
Investor-Psychology-Buy-Sell-Chart-062218.png (890×442)
2018-05-19_10-15-43.jpg (890×463)
SMART money selling to everyone else.
2018-06-22_8-26-09.jpg (890×469)
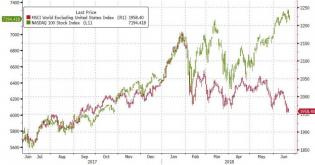
Ever-so-slight divergence of the NASDAQ from everything else outside the U.S.
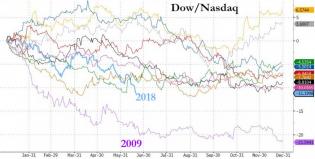
2018-06-21_12-27-25.jpg (890×452)
This is the worst year-to-date divergence between Dow/Nasdaq since 2009...

2018-06-19_8-10-32.jpg (890×449)
World's most systemically important financial institutions were falling dramatically.
1
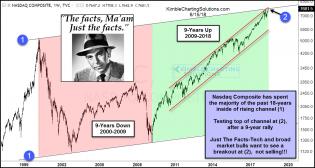
joe-friday-nas-comp-9-year-pattern-jun-15.jpg (1237×661)
Tech stocks analog
2
2018-06-13_9-59-07.jpg (890×471)
2

erf1yj8jcl311.png (5400×3585)
Severity of income inequality on a state-by-state basis
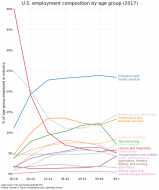
us-employment-by-age.png (773×922)
How Americans make a living based on their age
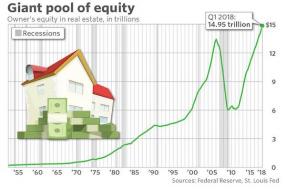
USHomeEquity.jpg (600×398)
A breathtaking chart about homeowner equity
3
2018-06-05_13-57-32.jpg (890×639)
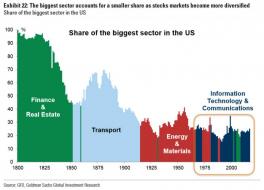
Sector dominance in the market
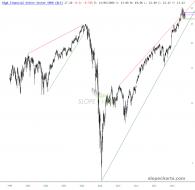
slopechart_XLF.jpg
One of my favorite analogs of all time.
DecxXsbVAAATTqJ.jpg:large (1130×870)
House Price versus Income - - NEVER a larger divergence
2
2018-05-28_6-36-03.jpg (890×472)
We are now at the peak of a similar shape and timed move as the 2008-2011 rebound...
4

2018-05-25_11-52-17_0.jpg (830×509)
That's............quite a divergence.
1
2018-05-23_12-35-04.jpg (890×464)
1
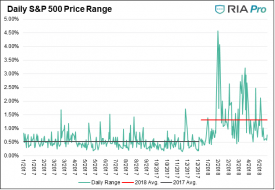
vol.png (626×431)
What a return of volatility looks like
1
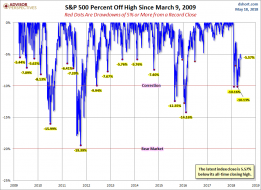
S&P 500 Drawdowns
Drawdowns from record highs
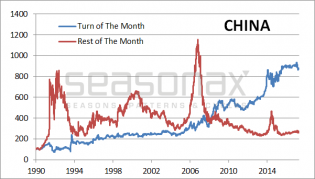
2-china.png (601×342)
Investing at end-of-month versus other times: CANADA
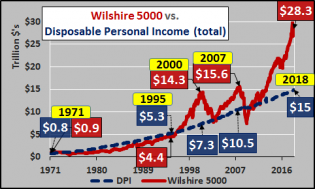
download (12)_0.png (482×290)
Wilshire 5000 vs. Personal Disposable Income
1
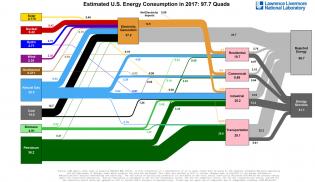
American energy use, in one diagram - Vox
Amazing diagram - - shows sources of energy and how much winds up wasted (about two-thirds)
1
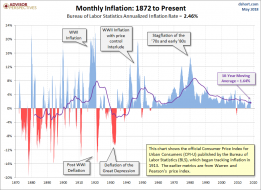
Inflation Since 1872
Monthly inflation over centuries
1
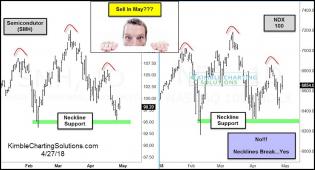
semiconductor-ndx-sell-in-may-topping-patterns-may-30.jpg (866×468)
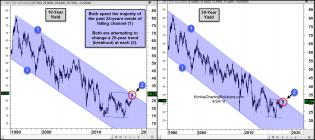
10-30-year-yields-attempting-25-year-breakouts-april-24.jpg (1567×700)
kvjlnjpltbt01.png (2491×1765)
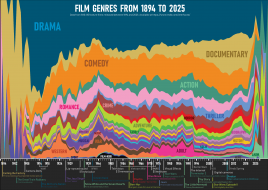
Film Genres through time