User: Hokie: Hokie's Stock Market Articles: Short Side Of Long: One More Bear Market, Please
Short Side Of Long: One More Bear Market, Please
Market Notes
Big Picture
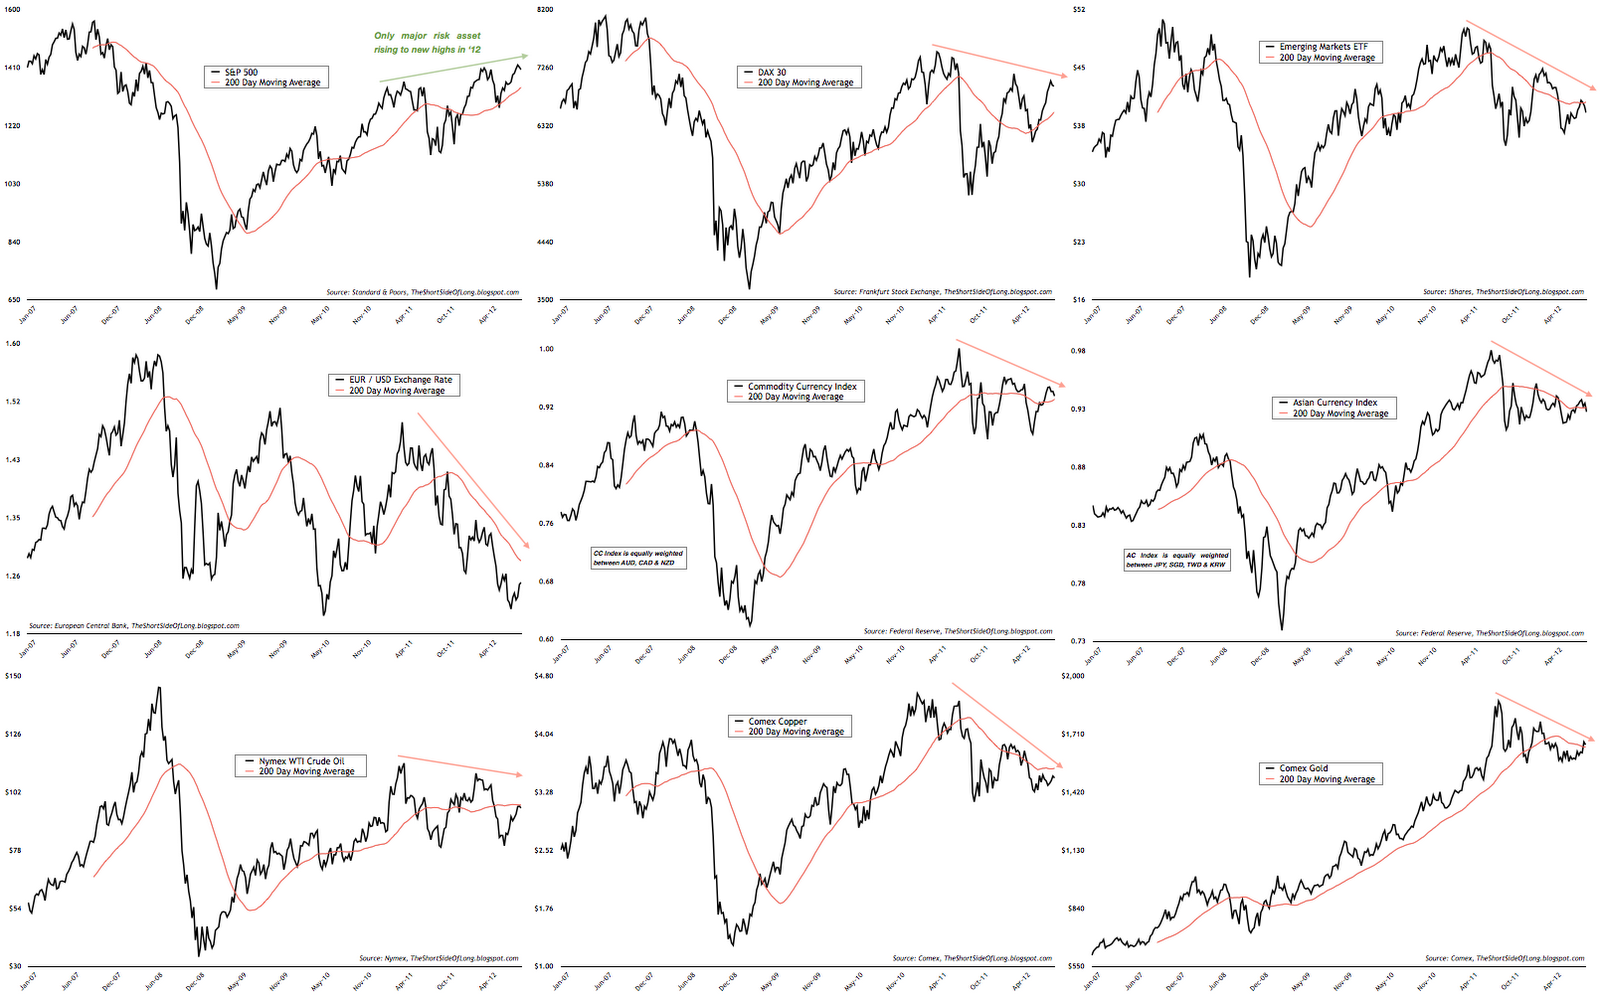
Industrial economic barometers like Copper and Crude Oil are failing to rise above their 200 day MA and more importantly are not confirming the S&P 500's new highs in 2012. The Emerging Markets, saviour of global growth in the post Lehman recovery, also continue to lag other equity indices indicating that not all is well with the BRICs. Furthermore, the short term rise in the DAX 30, Commodity Currencies and Brent Crude Oil (not shown here) has been almost vertical, so caution is advised. Finally, Gold, Silver and Platinum have technically broken out to the upside, but the real test will come as volatility of global risk assets rise and if the US Dollar starts to rally again.
Leading Indicators

We continue to see the Citigroup Economic Surprise Indices in mean reversion mode, which means the incoming global economic data continues to surprise economist's expectations. This has been a positive environment for risk assets. While the data has been positive relative to what economist's expect, the overall economic activity in the global economy is nothing to write home about. Let us focus on the main three economies, as we always do: US, Germany and China.
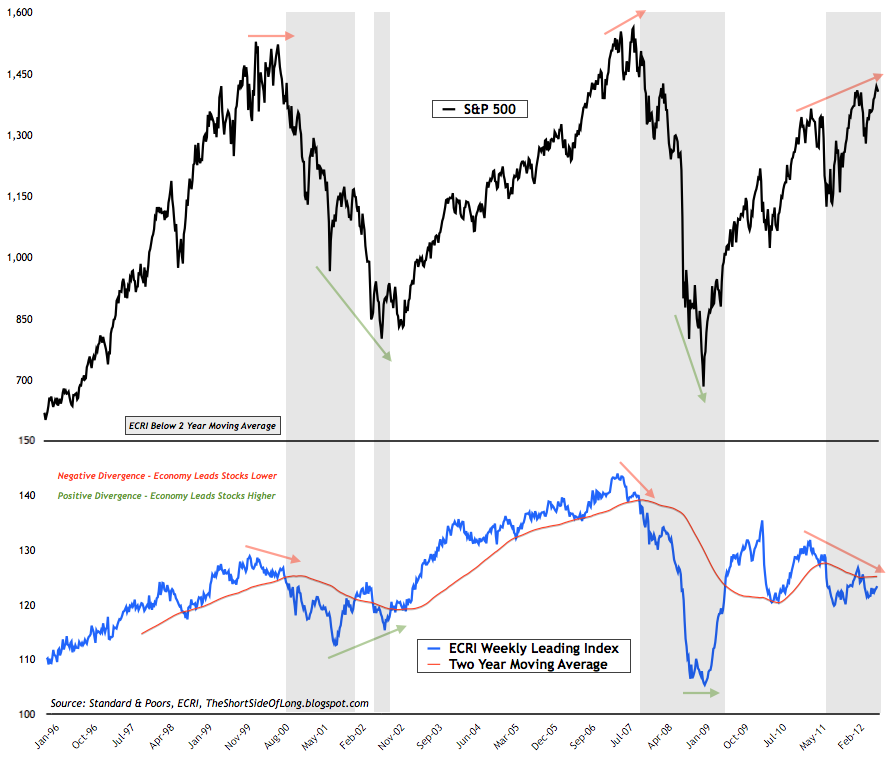
In the US, leading economic indictors continue to remain anaemic, with ECRI's Weekly Leading Index still below its 2 year moving average and in a downtrend of lower highs. It is important to note that there is a large disconnect between the WLI and the stock market. In my opinion, prospects of further easing have created a large price distortion relative to fundamental conditions (more on that in the featured article). However, as we well know the markets may misprice a security or an asset in the short run, but correct price will eventually be reached.

Besides ECRI's leading economic indicator, there are other indicators confirming significant divergence between Main Street and Wall Street. The chart above, thanks to Ed Yardeni's blog, shows that his own personal Fundamental Stock Indicator is in complete disagreement with the stock market over the recent multi-month rally out of the June lows. We've seen this many times before and should know by now how it ends: stocks usually play catchup to the downside.

Moving across the Atlantic, earlier in the week we found out that German business confidence, measured by the Ifo Institute, contracted for the fourth month in a row. Future Expectation (subcomponent) readings were extremely interesting, as it shows we are at levels where the previous German recession started in 1991, 2001 and 2008. In other words, Germany is on a cusp of another recession as we speak. Business confidence and the DAX 30
usually have very high correlation, but just like with US equities, the disconnect can clearly be seen here as well. That is because Super Mario has promised just as much easing on the right side of the Atlantic, as Helicopter Ben has on the left.

Finally, moving towards the biggest tail risk of the global economy: China. For weeks we have seen how leading economic indicators in this part of the world have continued to disappoint. The chart above shows a substantial slowdown in rail freight cargo volumes, which correlates highly with GDP figures (not that we can trust them anyway). The question I ask myself is; will the Chinese policy makers stay tight with monetary policy (in hopes of trying to deflate high property prices) or will they give in to fears of a hard landing and re-stimulate instead like they did in 2008?
Several days ago, I was in the middle of my usual morning reading, which led me to the chart below (thanks to Wells Capital Management). The article read: BEST EVER Post-War Stock Market Rally! and went on to explain how 800 plus days from the post-recession low, the current rally has gained 110%, beating all other famous generational bottoms from 1949, 1974 and 1982. With that in mind, I thought I would write about historical trends of the stock market for this week's feature section.

So before we start, it is important to understand the context and conditions we find ourselves in right now. Currently, we are in an equity bear market from a secular perspective and at the same time in an equity bull market from a cyclical perspective. Actually, we are in one of the "best ever" cyclical bull markets when it comes to performance gains and length (according to the article). So with that in mind, we can all agree that sooner or later, this powerful and aged cyclical bull market will end. While the majority of you will probably want to know the when, we will focus on the what. In other words, what happens next?
In the last century there have been three great secular bear markets. These are usually known as long sideways trading ranges, where the common theme tends to be frequent recessions, contracting valuations and general investor pessimism. While dates tend to vary slightly, the chart below shows secular bear periods to be from 1906 to 1920 (blue), from 1929 to 1949 (red) and from 1966 to 1982 (green). The current secular bear market started in year 2000 and is highlighted in black.
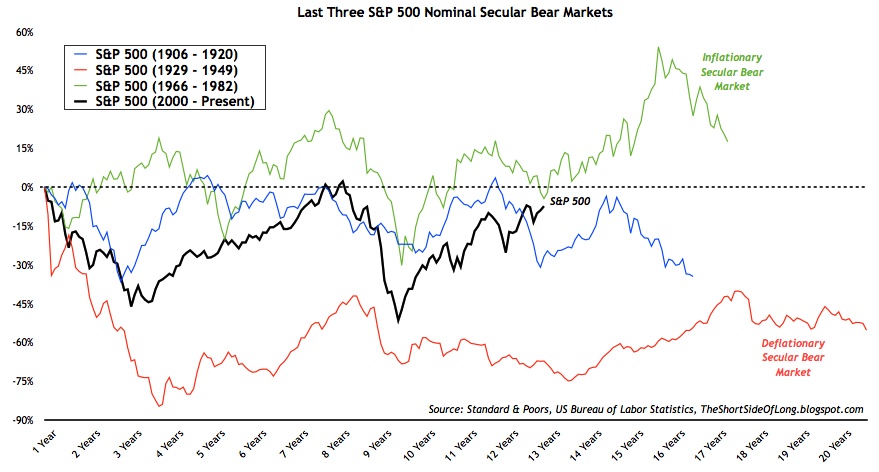
There are two important points to consider when it comes to secular bear markets. The first point is it's major theme. For example, during the 1970s secular bear market, the fundamental backdrop was of high inflation, while during the 1930s, the main fundamental backdrop was deflation. The second point is its length and number of major sell offs. On average, secular bear markets last on average 17 years. Currently, we are in the 12th year of this secular bear market.
The previous three secular bear markets experienced 4 major sell offs in the range of 20% or more (1930/40s we had 5), while the current one has seen only two so far. While many "gurus" are very eager to call the end of the current secular bear market, a quick glance at the historical trends in the chart above, will rule that out very quickly. Quite to the contrary, we could assume that there should be several more years of sideways movement and range bound prices to go with at least one more major cyclical bear market of 30% plus in declines.

A drop of 30% from the current levels of about 1,400 would take us below 1,000 on the S&P 500 and quite frankly would not be the end of the world (even though retail investors would panic like it was). Since secular bear markets trade in a sideways range, the majority of the losses do not occur nominally, but through inflation (chart below). When adjusted for inflation, an average secular bear market tends to lose about 60% or roughly two thirds of its real value over the period of 17 years. Currently we are only down about 7% in nominal terms and 30% in inflation adjusted terms (according to the US CPI data).
By now, you have probably noticed that when we compare the current secular bear market in inflation adjusted terms (black) it is the most overvalued in both price and time, relative to others. Hence why we are currently going through the BEST EVER Post-War Stock Market Rally! So what prolonged the current rally and what comes next?
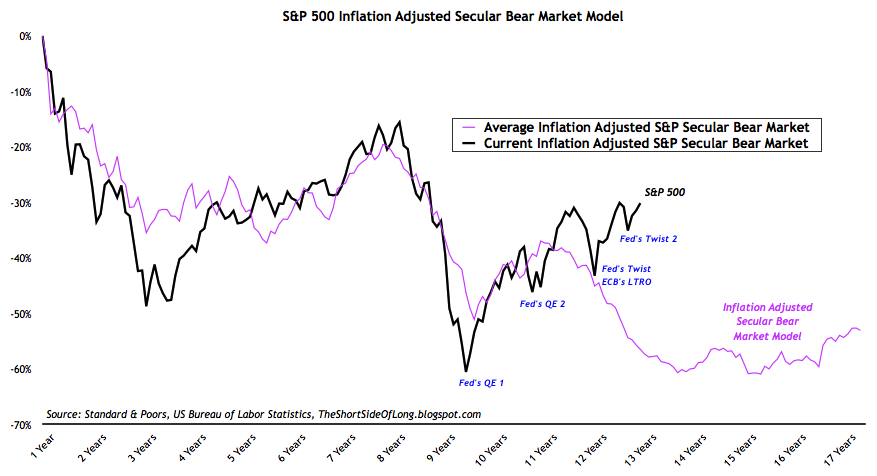
The chart above, showing an average inflation adjusted secular bear market, best explains what happened. The secular bear market model has worked very well in predicting the bottoms in 2003 and 2009, as well as the top in 2007. However, someone recently changed the price from previous historical patterns. In reality, we should have already declined meaningfully in 2011 and found some type of a bottom by 2013/14. Does anyone still remember the May 2011 peak at 1370? While the decline did start in 2011, Helicopter Bernanke and Super Mario postponed the equity bear between September and December 2011, by doing various forms of monetary stimulus. By refusing to let equities correct through natural free market forces, central bankers have now overvalued the current cyclical bull market. Therefore, this most likely means that the next fall will play catch up on the downside in a much more violent and swift manner. Downside mean revisions are never a pretty sight.

Away from the price and time aspect of tracking the current secular bear market, we also have at our disposal a fundamental valuation tool know as the Cyclically Adjusted Price to Earnings Ratio, also known as CAPE 10. In the chart above, we can see that all great generational buying opportunities occurred when CAPE 10 reached a single digit ratio. We saw this in 1920, 1932, 1942, 1949, 1974 and 1982. Since the March 2009 bottom never reached single digit CAPE 10, it will most likely not be a major low in inflation adjusted terms. Since the current CAPE 10 is above 20, it is highly likely that more sideways trading and more selling will come before the real bottom is in.
As a side note, do keep in mind the astronomical overvaluations we saw during the Tech Mania of the late 1990s, which could have prolonged this secular bear market, that commonly runs for about 17 years, towards a longer 20 year span like in the 1930s/40s. After all, over 27 years has passed since the CAPE 10 was anywhere near single digit readings.
So if now is the time to expect another bear market of cyclical nature (30% decline), the million dollar question is, when will it be time to buy? While I cannot tell each one of you what to do, I can express my own opinions on what I plan to do in the future:
Firstly I plan to respect both the time and inflation adjusted price of the current equity bear market. Relative to previous historical patterns, my secular bear market model shows that an expected bottom should be somewhere in the middle part of this decade. Secondly, I plan to monitor the way company earnings trend behave over a prolonged decade against price (CAPE 10) and only act if and when it approaches single digit levels. There needs to be a confirmation between point one and point two.
For a wise long term investor, who was willing to bet a farm on it, periods when CAPE 10 reached single digits and stocks returned 0% over 17 years occurred in three periods overs the last 120 years. These were between 1918 and 1923, between 1946
and 1949 and finally between 1978 and 1984. Buying equities during any of those periods and holding for at least 17 years, made fortunes. A buying opportunity, similar to those mentioned above, is not here yet. The important thing to understand for long term investors is that US equities are still overvalued. Mr Bernanke and Mr Draghi need to let the free market work and let us see at least one more bear market, please. Disclosure: I personally do not own any stocks right now and currently hold short positions in most economically sensitive cyclical sectors (refer to trading diary).Trading Diary (Last update 30th of August 12)
Long Positioning: Long focus is towards secular commodity bull market, with positions in Precious Metals and Agriculture. Largest commodity position is held in Silver, with central banks gearing to print money, as the global economic activity deteriorates. Since Silver has broken out recently, hedges have been removed and a small purchase was made. Any negative reversal, as global risk asset volatility rises, will call for hedging again. NAV long exposure is about 100%. Short Positioning: Short focus is towards secular equity bear market, with cyclical sectors and credit offering best selling opportunities due to deteriorating global economic activity. Mild to modest exposure is held short in the Junk Bond market, as well as various economically sensitive cyclical sectors like Technology, Discretionary and Dow Transportation. Apple parabolic has been shorted with long dated 2014 OTM puts and recently Put options have been purchased on the Pound and the Loonie (long USD). NAV short exposure is about 65%. Watch-list: A major short in due time will be US Treasury long bonds, as they are extremely overbought and in a mist of a huge bubble mania, but first we have to wait for the Eurozone dust to settle. Finally, while Grains have exploded up, Softs still present amazing value for long term investors, with Sugar being my second favourite commodity (after Silver).What I Am Watching
Comments
No comments yet.

