 Violet
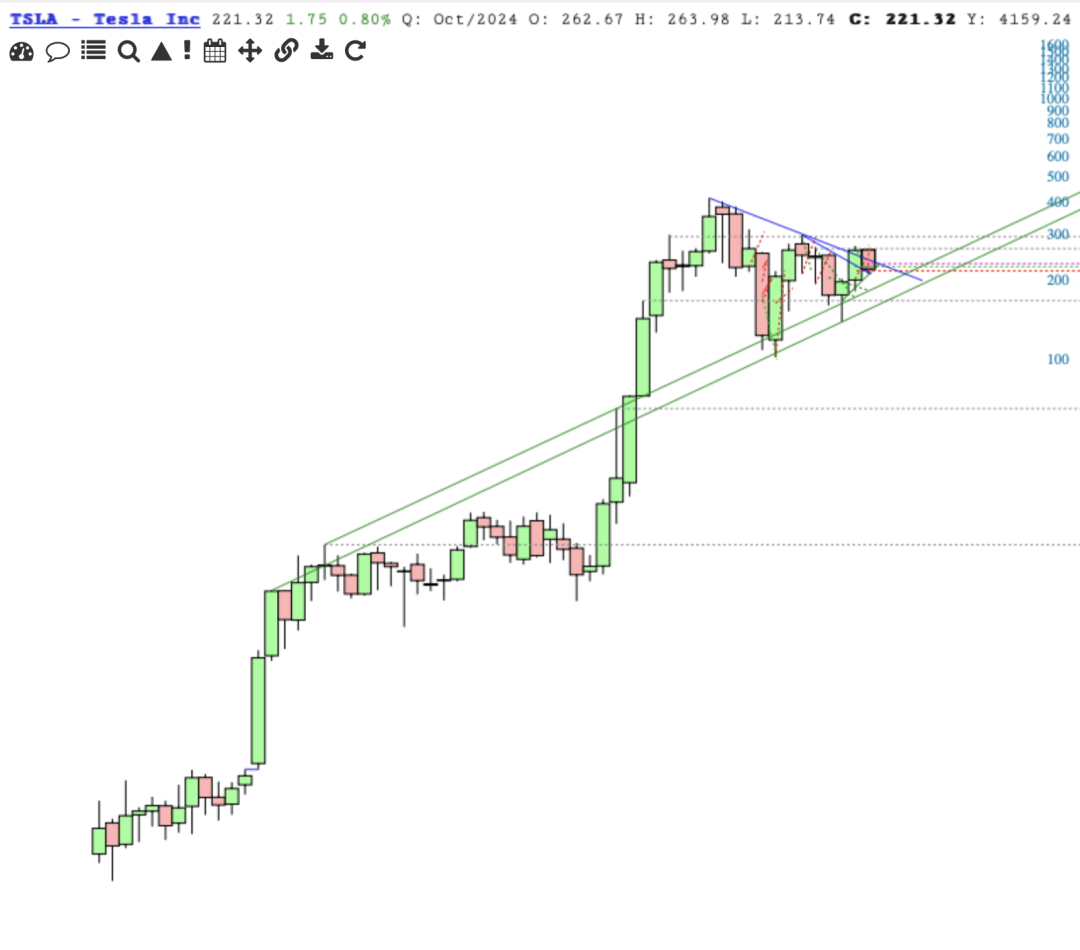
User: Violet: Tech: slopechart_TSLA.jpg
slopechart_TSLA.jpg
TSLA - A fourth consecutive, today's doji lies in the middle of the Ichimoku Cloud.
Orange oval: This is the 3ema crossing below the 10ema. (What Morrise uses to be long.)
The double top on 4Oct marks the 3ema's backtest of the 2Oct breakdown (3ema below 10ema). The next day price, breaks support of the red dotted uptrend from the August low.
Filling the upper gap won't make this chart bullish.
TSLA is considered to be strugging until it breaches the upper blue trendline.

