Users: cekk99: All Pages
content.screencast.com/use...OMPQ11413.gif

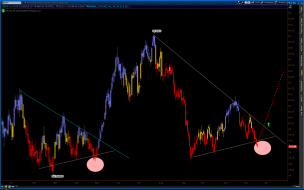
content.screencast.com/use.../DJI11313.gif
My Blog

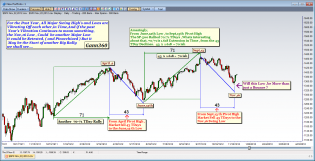
coffeebreakoutjan111.gif (1575×728)

herbalifeshakeupjan91.gif (1576×729)
3
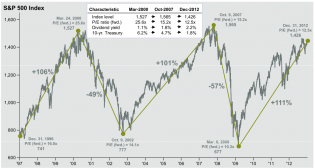
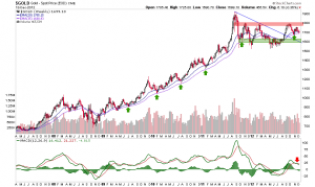
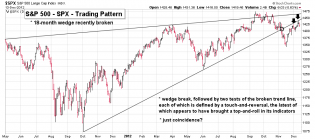
SP-500-97-2012.png (1057×566)
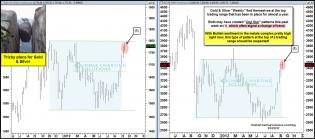
Update: It's Truw...It's Truw Well the dollar $DXY is breaking o...

50030yryieldremoteinfluencejan3.gif (1571×702)
1
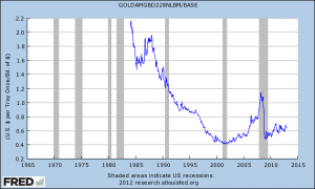
gold and base

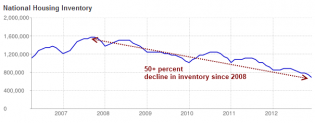
us housing inventory

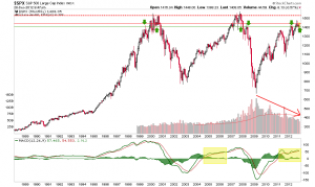
spx monthly
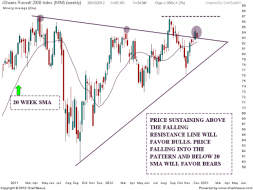
IWM Chart analysis | Nifty charts and latest market updates

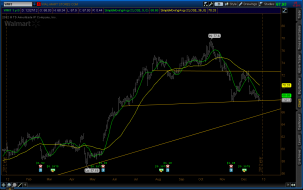
wmt short.png

SharePlanner Reversal Indicator 12-27-12

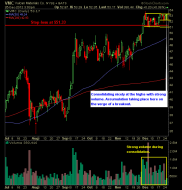
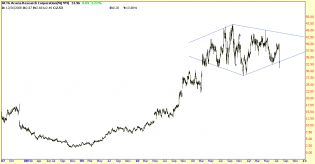
vulcan materials swing trade
email-2887007.73.png

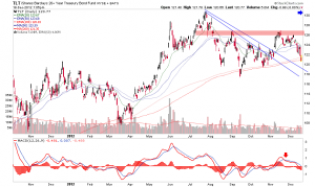
tlt
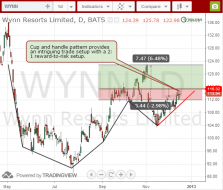
Wynn Resorts WYNN Swing trade cup and handle pattern
$DXY - Here is a little bear's only hope... Over the past year I...
1
gold
bikinianalytics.com/wordpr...y-14dec12.png

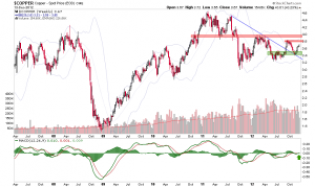
copper

2012-08-07_1124 - chartwiz's library

6
20121213_citi11.png (1030×740)
chinafxistrongoflatedec10.gif (1574×727)
fcxcopperbouncedec6.gif (1575×728)
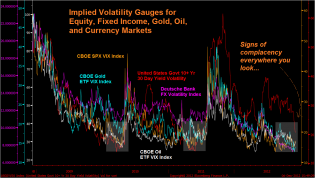
impliedvolatilitylow.png (1282×727)
1
coffeefallingwedgebreakoutdec7.gif (811×667)
transportupsidebreakoutsdec111.gif (1556×687)
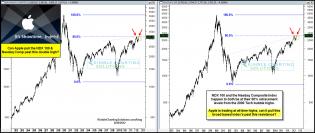
joefridayappletripledsupportdec7.gif (1575×732)
2012-11-22_1647 - chartwiz's library
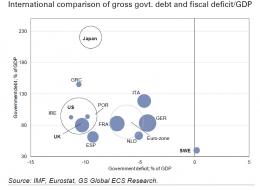
Debt-to-GDP Charts
coppersupportnyseneedstoholdnov14.gif (1575×729)
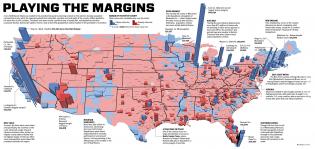
election-margins.jpeg (2300×1090)
500luckychartrepeatingrisingwedgesnov104.gif (1576×725)

20121112_SPX1.png (710×384)
3
dollar10yearchannelhurdlenov7.gif (1576×729)
1
qe3injectionsupportnov7.gif (1558×664)
1
joefridayeurobreakingsupportnov22.gif (1573×727)
applebreakskeychannelsupportnov2.gif (1577×731)
crxbreaksshorttermsupportoct30
joefridayyieldbreakoutoct26.gif (1560×704)
smallcapsrepeat3rdtimeoct25.gif (1574×729)
crudeoil500indexendofflagoct25.gif (1574×729)
dow70yearchannelrisingwedgeoct23.gif (1576×730)
iyrheadandshouldersfalloct23.gif (1575×732)
eurodollarhammertimeoct23.gif (1577×733)
30yearyldgomeroct24.gif (1577×730)
eurofcxfallingresistanceoct18.gif (1558×662)
ndxgoogleoct18.gif (1560×692)
chinastrengthresistancetestoct17.gif (1576×730)
europullingthe500higheroct17.gif (1575×729)
beansreadytofall30percentagainsept17.gif (1578×731)
highyieldfundsabove50reflectingrsoct162.gif (1560×665)
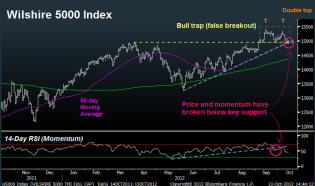
Wilshire5000bearishducks
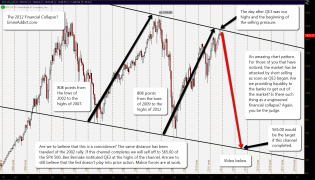
2012crash_001
1
dollarrallyclosefishmouthoct9.gif (1577×729)
ndxstopinthenameoffiboct9.gif (1577×730)
eurounderpressureoct8.gif (1561×666)
joefridaygoldsilveratchannelresistanceoct5.gif (1576×693)
shanghaineedsbounceoct4.gif (1577×729)
beansreadytofall30percentagainsept17.gif (1570×723)
crudeoilpulling500lowersept261.gif (1575×729)
dshort Featured Charts
1
30yeartltfoolyouoflatesept27.gif (1560×666)
tltcountertrendrallysept25.gif (1581×734)
goldsilverweeklydojistarsept24.jpg (1560×692)
eerw.png (607×453)
0920chart.jpg (1280×776)
Treasury Yield Snapshot
dshort Featured Charts
1
joefridaydjworldindexresistancesept21.gif (1574×727)
transportsdrivethruresistancesept13.gif (1576×729)
bondshangingbyanecklinethreadsept13.gif (1558×664)
joefridaycurrencytrendreversalsept14.gif 1,562×665 pixels
1
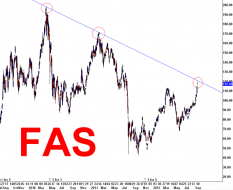
FAS
slvslwatresistancesept11.gif (1558×660)
1
tltheadandshoulderssept12.gif (1576×730)
The Modern World_1.jpg (818×596)
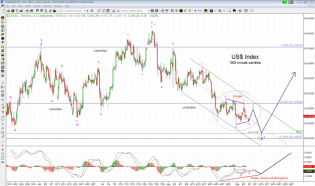
US Dollar Index 360m 9-6-12

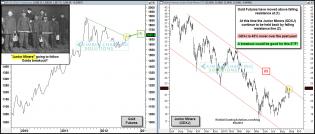
juniorminersabouttobreakoutsept6.jpg (1560×665)
dshort Featured Charts
Screen Shot 2012-09-04 at 9.47.04 PM.png
1
bricvsussept5.gif (866×320)
jnkhyg500breakstruggleatresistancesept4.jpg (1562×669)
bricsbreaksupportsept5.gif (1559×661)
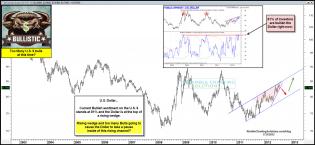
dollarbullisticjuly31.jpg (1577×729)
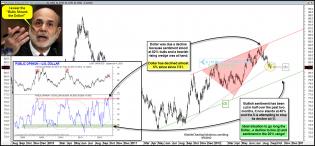
dollarbernakebullshrankthesept5.jpg (1577×731)
bkxregionalresistanceaug292.gif (1560×692)
20120829_BRIC.png (720×378)
dshort Featured Charts
eemdangersouskissaug30.gif (1577×730)
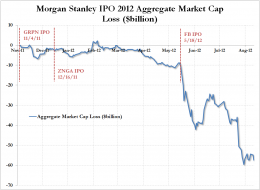
20120814_MSIPO.png (1124×819)
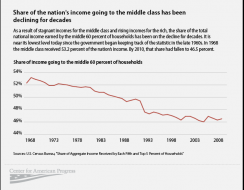
MiddleClassGraphs_web_21.png (621×482)
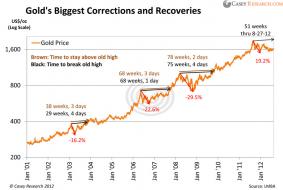
GoldsBiggestCorrectionsandRecoveries_0.jpg (792×530)
Northern Dynasty Minerals NAK
Government Spending as Percentage of GDP
dshort Featured Charts
1
ndxnascompat50percentfiblevelsaug28.jpg (1561×663)