Users: Coe Courier: All Pages

sc.png
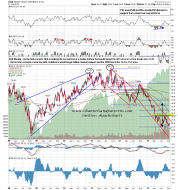
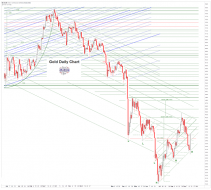
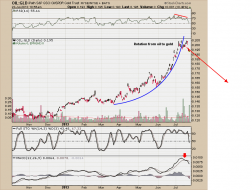
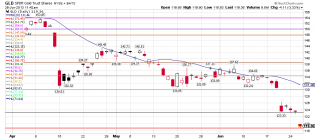
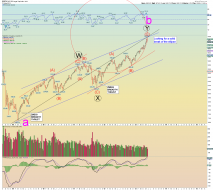
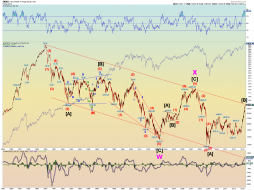
From Robert Cote. Trading Bands on Gold chart.

1
sc.png
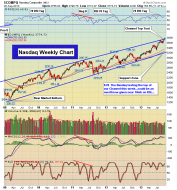
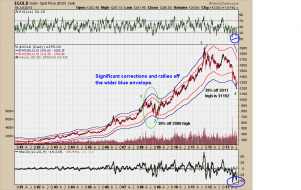
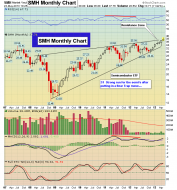
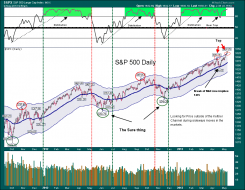
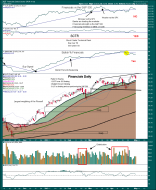
From David Larew. What a run in the last 12 months. Which means, in any pull back, this one gets it first.
3
sc.png
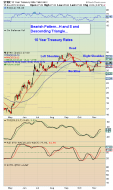
From Michael Pitre. Head & Shoulder top a possibility.
TNX has more than doubled from its July 2012 low.
sc.png
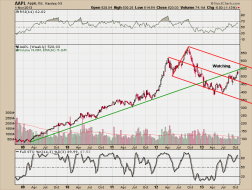
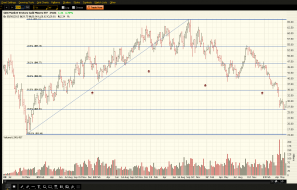
AAPL appears to be back testing its trend line from '09.
From Robert Cote.
sc.png
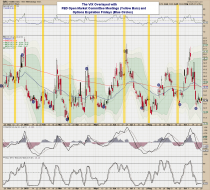
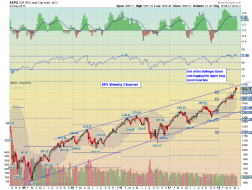
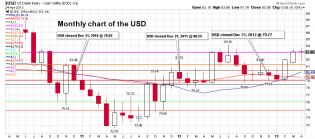
From David Calloway. Fed Meetings, Op Ex and the VIX.
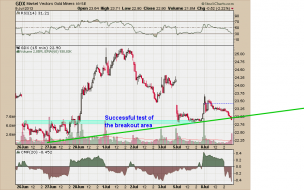
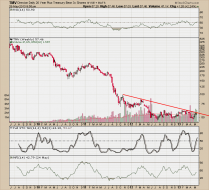
131022 GDX Weekly Falling Channel and Double-Bottom.png
Thanks SHJ.
sc.png
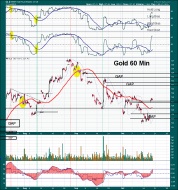
When it comes to Gold, I'm like spooky Mulder. I want to believe. Mind the Gaps.
sc-1.png
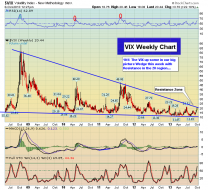
From Robert New. The VIX is on the verge.
1
sc-1.png
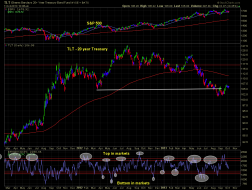
From David Larew. Looks like TLT wants to form a right shoulder. The drama in dc dovetails into this pattern.
sc-3.png
From Robert New. Channel appears full, complete with a throw over at the top. We'll See !
golddaily9-1.PNG
From Jesses Cafe Americain. Gold appears to have completed an inverted h/s pattern.
sc.png
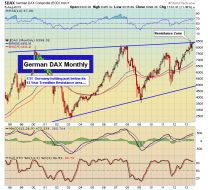
From Robert New at Stockcharts. Dax bumping up against
13 years of resistance.
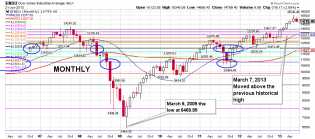
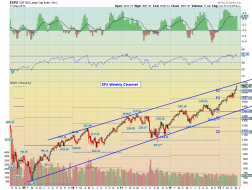
sc.png
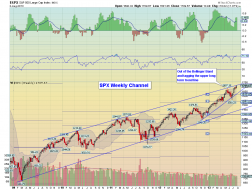
Here we go again...back at the top of the weekly spx channel from '09.
sc.png
Oil: Gold ratio looking to take a breather
sc.png
Gold and the 38% retracement
goldlongterm.JPG
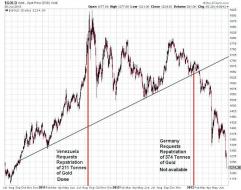
From Jesse's Cafe. The Bigs get nasty when
they are exposed.
sc.png
22.75 would seem to...
sc.png
From Ted Burge at stock charts. Support on GLD near today's low. Also support at 114.56 and 112.77
sc-2.png
Horizontal support on the indu comes into play around
the 13930 area. Translates loosely into 1500 on the spx.
1
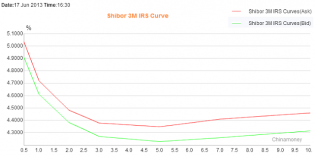
China Interest Rate Swap Curve.PNG
Chinese Interest Rate Swap Curve.
Any one want to bet against an inverted yield curve ?
sc-1.png
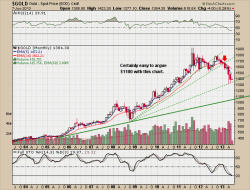
IF the bullion banks are running the show. My guess is
they will try to crash this mother one last time. Sub 11...
1
sc-1.png
Usually i don't find circle over lays very meaningful.
But this is a nice one. Also includes some interesting
tren...
1
2013-05-30_gdx_weekly_fibs.png
gdx fib lines, from protected returns blogspot
sc-2.png
TMV, $TNX and $TYX breaking out today
sc-10.png
Hit the top of the trend line last week
sc-3.png
The semi ( maxi) wedge
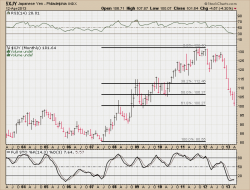
sc.png
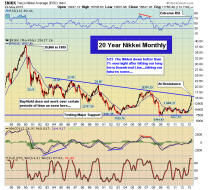
Nikkei at trend line resistance
big.chart.gif
FXY, GLD and SPX in lockstep
1
sc-7.png
gold:gdx ratio. this ones got my attention
sc-3.png
channel from 2009

trust.jpg
1
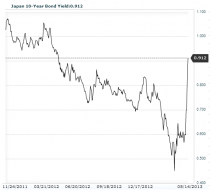
JGB 10Y.PNG
JGB 10yr. CB buys JGB, yields soar ?
sc-4.png
Keltner Channel Buy and Sell Signals.

Inger-Stevens-Feet-289916.jpg
Bears are Walter Matthau. Inger Stevens is Ben Bernanke.
sc.png
INDU/VIX ratio
sc-1.png
No worries mate
sc-1.png
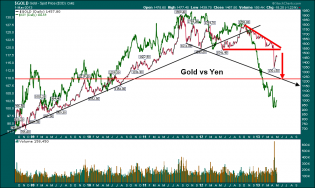
Yen vs Gold in USD.

MW-BB911_no_exi_20130424145245_MG.jpg
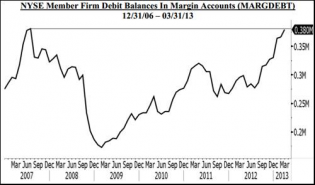
mergindebt.png
Margin Debt
sc-1.png
The XLU is having an out of body experience. This is a monthly chart and would suggest that , at minimum, a pull b...
2
Gold-Bullion_Oscillator_FT-lg.gif
Comex may not be on the "verge", but we
are entitled to more than a little bounce.
sc-2.png
The Nikk at a major trendline
sc.png
Since August 2010, the 83 level has been a tough nut to crack,
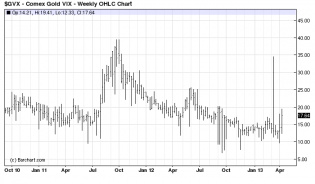
9aac9dce5896624c2ff234b67e9e98f5.png
can't say i follow the gold vix. but this
doesn't look like a bottom in gold is near.
sc.png
Yen sitting on a round number and a fib line