Log In
|
Create Account
Chart
Chart Lab
Drawn Objects
Guide to Patterns
Mobile Charting
Modes
Power Features
Reference Manual
Rotation Graphs
SlopeCharts
Video Guide to SlopeCharts
Equities
Biggest Companies
Correlations
Earnings
International Equities
Logo-Based Calendar
Real-Time SlopeAlerts
SlopeMATRIX
Super Summary
Today’s Movers
Woulda Shoulda
Markets
Commodities
CryptoStream Live
Economic Database
End-of-Day Report
Macroeconomics
Market Meter
MetaSymbols
SlopeRules
The Matrix
Yield Curve Tool
Options
Backtest Strategies
Chain Quotes
Earnings Reactions
Options Analytics
Payoff Analyzer
Strategy Explorer
Trading Strategies
Virtual Trading
Volatility Calendar
Volatility Matrix
Read
Best Posts of All Time
Books by Tim Knight
Comments Search
Guide to Comments
Latest Posts
Mobile Apps
Profile of Your Host
Recommended Books
SlopeBot GPT AI
Watch Slope Videos
Social
Activity Feed
Browse Chart Database
Guide to SocialTrade
Hall of Fame
Members Directory
Published Watch Lists
Publishing/Subscribing
Search SlopeRules
SlopeTalk LIVE
Virtual Trading
Help
Best Pages For You
Guide to the Site
Membership Levels
Pattern Video Library
SlopeCharts Reference
SlopeMatrix Guide
SlopeRules System Builder
SlopeTiles Customization
Using SlopeTalk
Video Guide to Slope
Log In
Create Free Account
Memberships
User: esvxm
Profile
Location: United Kingdom
Member Since: 3/24/14
Instruments
Stocks
Futures
FOREX
esvxm's Profile
Personal Stacks
European Indices
Forex Patterns
Precious Metals
US Indices
All Pages Stacked
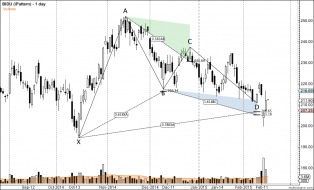
BIDU - iPattern - Feb-14 2037 PM (1 day).png
BIDU stock forms a key pattern. www.marketchartpattern.com
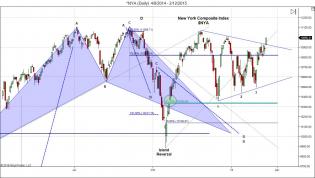
^NYA (Daily) 4_8_2014 - 2_12_2015.jpg
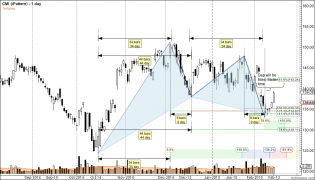
CMI - iPattern - Feb-14 1241 PM (1 day).png
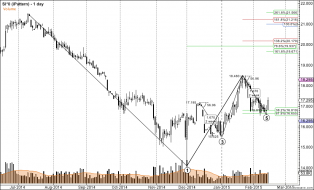
SI0 - iPattern - Feb-14 1833 PM (1 day).png
^XAUUSD - iPattern - Feb-14 1737 PM (1 day).png
EURGBP_Daily_10March14.png
Could this be the low for EURGBP. Price and time meet. Is the pattern complete?
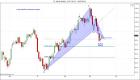
EURGBP_DAILY_27MARCH14.png
EURGBP at the 61.8% Retracement and AB = CD pattern.
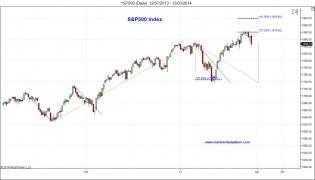
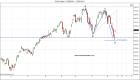
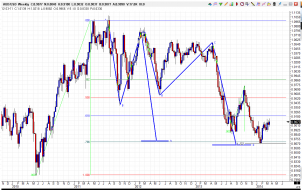
^SP500 (Daily) 12_07_2013 - 13_03_2014.jpg
S&P500 getting stopped by the 127.2% Fibonacci expansion.
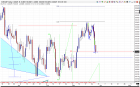
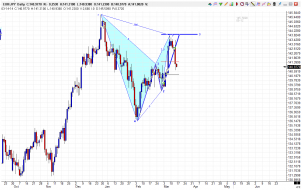
$USDJPY (Daily) 11_12_2013 - 14_03_2014_2.jpg
USDJPY forming a Fibonacci pattern.
1
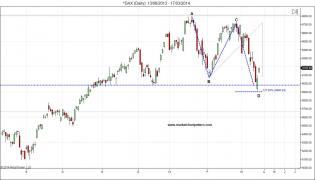
^DAX (Daily) 13_08_2013 - 17_03_2014.jpg
German DAX 30 (Cash)
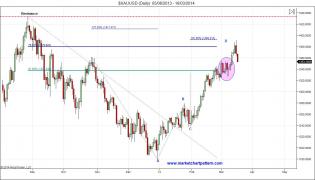
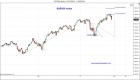
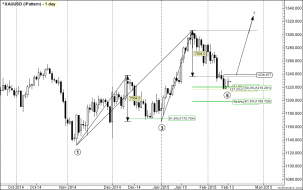
$XAUUSD (Daily) 05_08_2013 - 18_03_2014.jpg
Gold at the 161.8% Fibonacci extension. www.marketchartpattern.com
EURJPY_Daily_13March14.png
Price being held by the AB = CD pattern
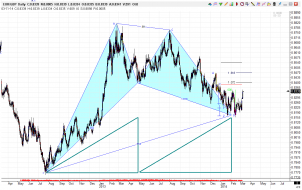
AUDUSD_WEEKLY_22MARCH14.png
Aussie dollar find support at the key Fib support levels.
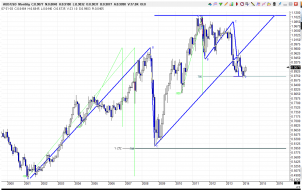
AUDUSD_MONTHLY_22MARCH14.png
www.marketchartpattern.com
1
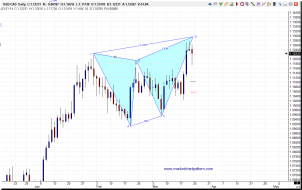
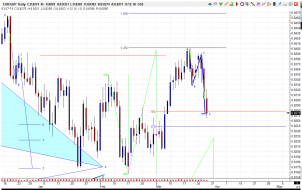
USDCAD_DAILY_23MARCH14.png
View more pages