Users: eyeSPY: All Pages
E-Mini-13-08-30.PNG
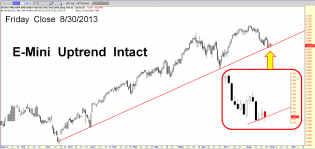
E-Mini Uptrend is still intact.

1
E-Mini-2013-08-27.PNG
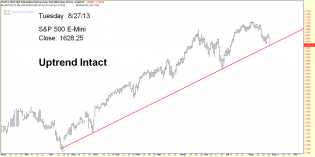
S&P E-Mini uptrend was not broken today.
3
SPY-2013-06-30.PNG
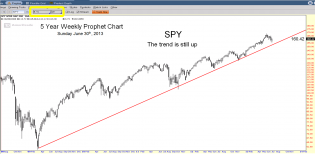
5 yr Wkly of SPY on June 30th, 2013
TDAmeritradeChart.JPG
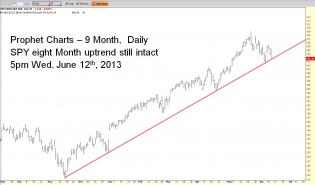
SPY-Uptrend.JPG
SPY - eight month uptrend intact
Excel-DDE.GIF
Using Dynamic Data Exchange (DDE) with Excel to get Option Prices
2
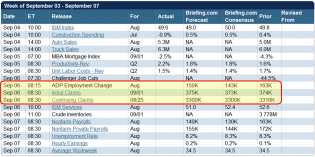
Anouncements Sept 03 - Sept 07.PNG
Dates, times, estimates and results for key U.S. economic releases.
Last Update: 05-Sep-12 08:31 ET
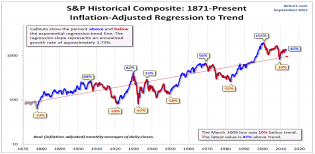
Secular Highs and Lows.PNG
S & P 1871 to Present
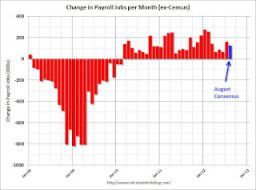
Monthly Payroll.png
Employment Report for August will be released on Friday, Sept 7 at 8:30 AM ET. The consensus is for 125,000 non-fa...
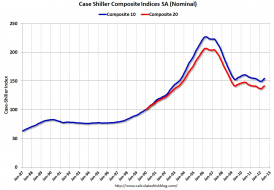
Case Shiller Housing Index.PNG
Case-Shiller: House Prices increased 0.5% year-over-year in June.
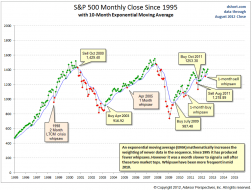
S&P 500 Monthly Exponential MAV.PNG
S & P 500 Monthly Close since 1995 with 10-month Exponential Moving Average.
1
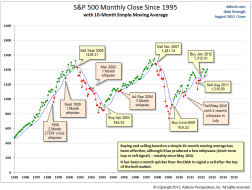
S&P 500 Monthly Simple MAV.PNG
S & P Monthly Close since 1995 with 10-month Simple Moving Average.
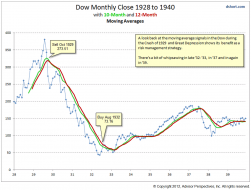
1929 Market Crash.PNG
What Grandpappy shoudda done.
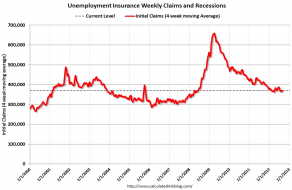
Weekly Unemployment Claims.PNG
30 Aug 2012 - Weekly Initial Unemployment Claims at 374,000
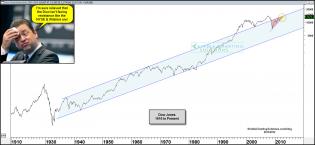
dow70yearrelievedresistanceaug23.jpg (1574×727)
Long Term DOW

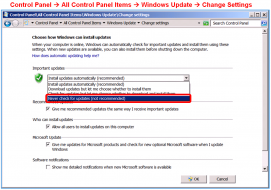
Turn Off Windows Updates.PNG
Turn Off Windows Updates
Click to View
S&P with regression line
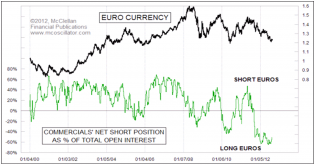
Euro COT Data.PNG
Taking a Look at COT Data For The Euro
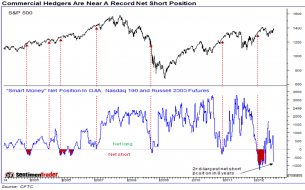
SentimentTrader_hedger.png
"Smart money" commercial hedgers in the equity index futures moved close to an 8-year extreme net short position i...
1
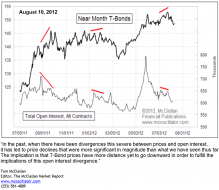
T-Bonds vs Open Interest.PNG
Open Interest Gives A “Tell” For T-Bonds
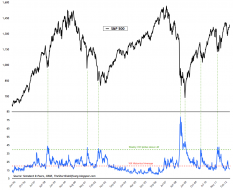
VIX+Index.png (914×744)
VIX at Major turning points
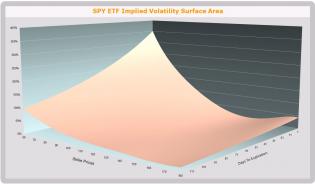
SPY IV Surface Area.JPG
Implied Volatility Surface Area of the SPY ETF
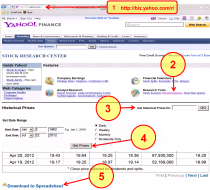
FreeHistoricalQuotes.PNG
Get free Historical Quotes for backtesting/research. Check out Yahoo's "Stock Research Center". It has an amazing...
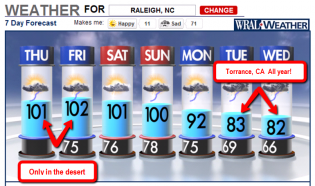
Weather.PNG
CA weather
Click to View
S&P with linear regression

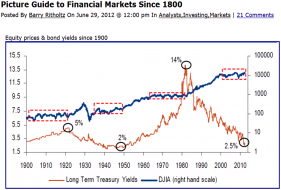
Equity prices & bond yields since 1900.PNG
Equity Prices & Bond Yields since 1900

Seasonal Charts: S&P 500 Index | Signal Financial Group

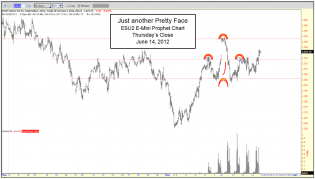
Just Another Pretty Face.PNG
Failed Head & Shoulders
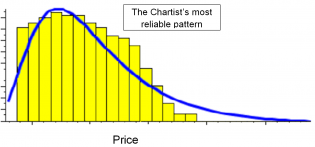
Best Chart Pattern.PNG
Best Chart Pattern
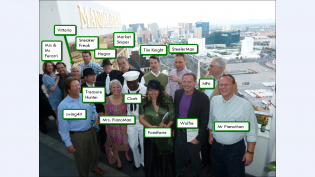
2012-05-20_2040 - Victorio91306's library
Slope-of-Hope people with their nicknames
3
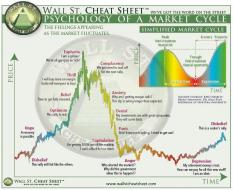
Emotion cheat sheet..jpg
Wall St. Cheat Sheet

10
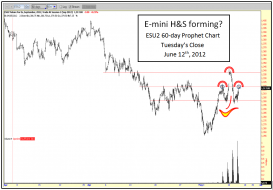
E-Mini H&S forming.PNG
E-mini H&S forming?
1