Users: fernandinho: All Pages
esi aug 24.png
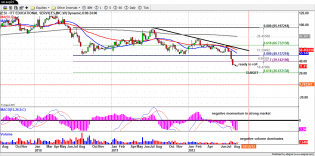
expensive borrow but worth it.. should see the capitulation before year end

dv aug 24.png
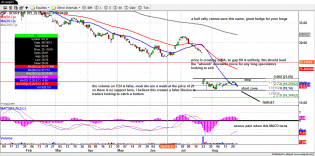
this thing is doomed
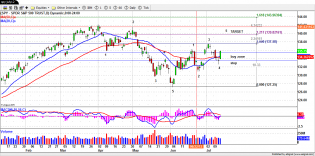
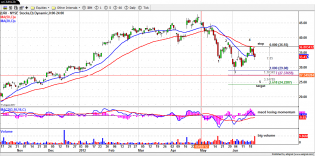
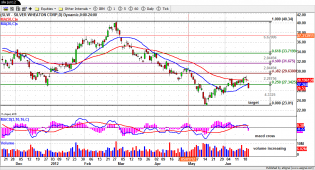
wmt aug14.png
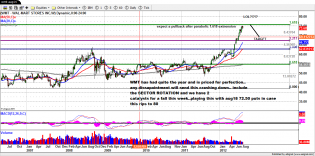
end of weekly wave 5? earnings and sector rotation catalysts... potential for huge dowside... momentum has been we...
gsvc aug1.png
the sub ponzi scheme that invested in a bunch of other ponzi schemes ... with mulitple offerings diluting their p...
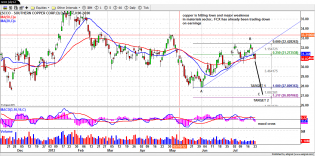
scco july12.png
broke its upward channel.. expecting a return to lows with rest of sector.. earnings shoud drop this thing fast
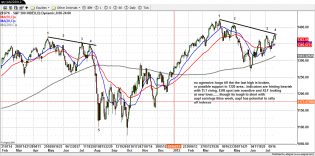
spyjuly222012.png
.. caution on longs... will short if AAPL earnings falter.... otherwise looking for break of138 and support of 133...
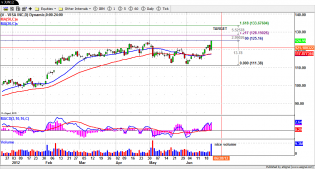
spy july12.png
we are in start of a wave 5 push higher.. classic .618 bounce on Friday.. should see extention to 1.217 (139.8),
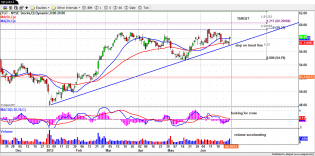
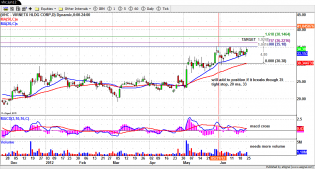
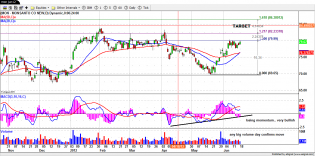
tgt july12.png
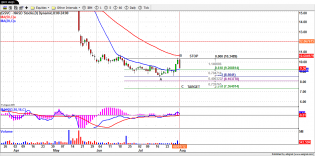
easy trade..bull flag with accelerating volume... looking for the parabolic WMT type move. stop on the trend line
vhc jun12png.png
acting strong on weak tape
V jun12.png
ready to go boom
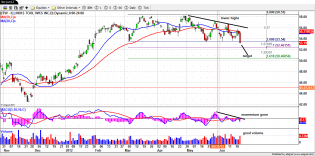
uri jun12b.png
possible wave 5 move with big volume selloff (sympathy $R)... 37 stop.. target is 0 and below
itw jun12.png
looks like
slw jun12.png
http://i901.photobucket.com/albums/ac214/greedynyc/charts/msgjun12.png
mon jun12.png
http://www.twitter.com/fernandinho_ny
sm jun12.png
http://chart.ly/9nvu8ii
SM mentioned on slope of hope
acat jun12.png
this gap will not get filled....28 is next support

pep jun12.png