Users: Foxton: All Pages
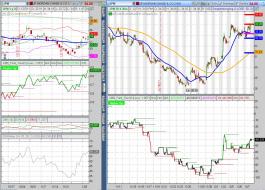
Dow Chart.png
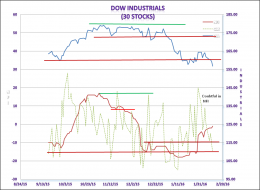
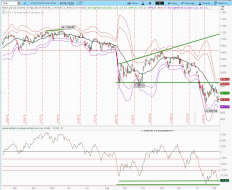
The DOW Industrials are the main component in the DOW Composit. The net field trend is Doubtful for the Industrial...

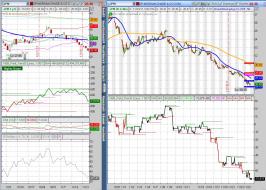
Transports Chart.png
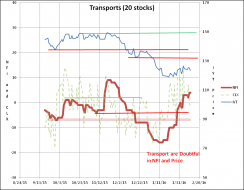
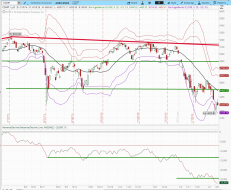
The Transports are part of the Dow Composit index and have started to roll over with the lower prices in the markets.
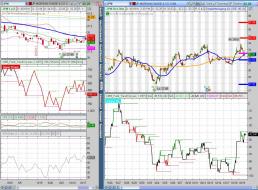
Utilities Chart.png
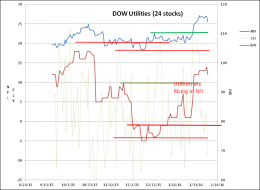
The Utilities are part of the DOW Composit and the Net Field trend has Just turned over showing that the utilities...
2
Composit Chart.png
NYA adv dec.PNG
1
NASDAQ adv dec.PNG
1
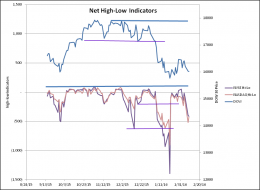
Hi Lo Chart.png
1
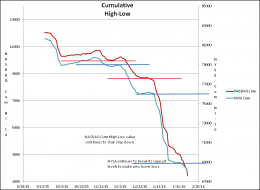
hilo cum chart.png
2
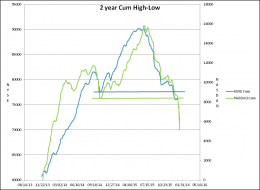
2 year cum hi lo.png
1
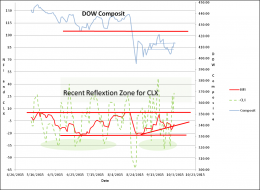
Composit Chart.png
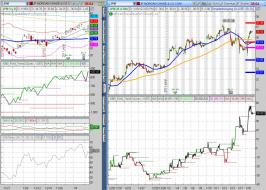
JPM 2012 1 18 Bottom.JPG
Breakout from First Resistance
1
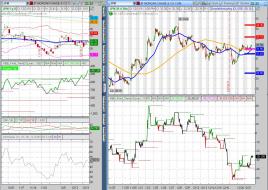
JPM 2011 12 21 Bottom.JPG
First resistance
JPM 2011 12 7 Bottom.JPG
Exit from second bottom
JPM 2011 11 23 Bottom.JPG
Entry into Second bottom

JPM 2011 11 16 Bottom.JPG
Entry into second bottom

JPM 2011 11 2 Bottom.JPG
Exit of first bottom
JPM 2011 10 19 Bottom.JPG
Entry into First Bottom

JPM Double Bottom Overview.JPG
JPM Double Bottom Study using RSI and OBV with targets and results