Users: Funatwork: ES Quantitative Analysis | Slope of Hope
ES Quantitative Analysis | Slope of Hope
All right, a couple of notes before we begin the ES analysis for today:
1) someone pointed out that a Stop Loss at 1734 is very far away, adding that no one sane in his mind would take 100 points in his face like that. First of all, the Stop Loss must be put in context: that number, 1734, represents the END OF THE RANGE that we consider “tradable” for LONG trades. This means that we have a preferred LONG trading price range where we think Swing Trading techniques can be successful. If the price goes below that level it means this is no more Swing Trading but Nose Diving/Crash, etc., something else, so you better get out quick (Stop Loss at 1734). It does not mean you enter a trade at 1813 and exit at 1734, we agree that does not sound very smart and in fact we have NEVER suggested to do so. There would be some more comments to add in regard to the fact that in some circumstances, and with certain deep pockets, one may actually be able to trade the entire range, from 1813 to 1734 and make a profit, but this goes out of our scope here, so we will not get into that.
2) RL does not predict long-term trends: trends are the historical result of a series of prices in time, they are interesting for historical analysis purpose but they cannot predict anything beyond the point they reached the moment you looked at them. The maths behind a trendline require a plot based on past numbers, so you cannot obviously predict the future with it (although many people deludes themselves tracing the linear trendline into the future, making forecasts that have zero scientific value, wishful thinking at best…). What RL does instead it is to compare the next “potential” (un-manifested yet) price swing with other “similar” past swings, in order to place the upcoming “potential” swing in context, so that we can predict more or less what the upcoming swing size will be and then use that information for our trading strategy. Summing up: trend-predictors take a trend that has appeared in the past on a chart and then trace a line to continue that trend into the future and pretend that is a reliable forecast of where the price will go, RL instead predicts where the (upcoming next) trend will END. There is a huge quality and substantial difference in these 2 approaches: one looks at the past and hopes for a continuation into the future (that is what retail traders usually do: buy at the top after a multi-month trend appears on the chart, or go short at the bottom at the end of a Bear Market). The RL approach instead looks at quantitative past data to CLASSIFY the next, upcoming, price swing and predict how far it can extend. Basically RL predicts THE END OF THE TREND, while trend-predictors pretend to predict THE CONTINUATION OF THE TREND into the future (forever possibly).
The above should shed some light on how to correctly use RL’s Quantitative Research.
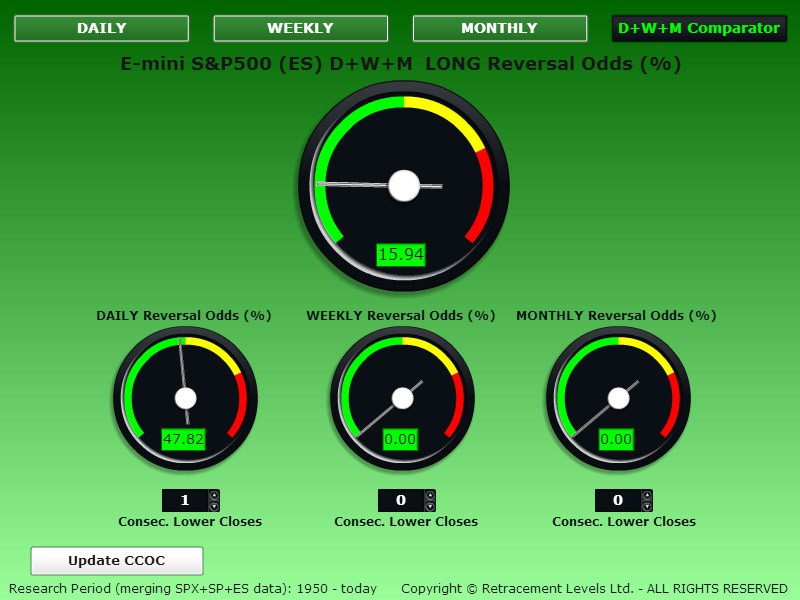
TO GO LONG ANALYSISThe CCOC DAILY gauge below is showing coin flip odds to GO LONG. One day down is not much, from a TIME perspective, if we had 2-3 days down we would be more sure that a bounce is imminent.
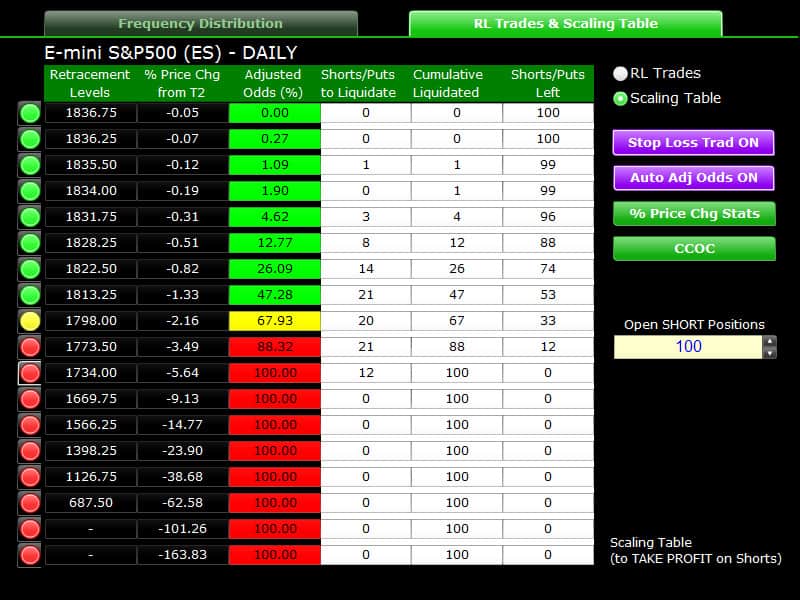
On the LONG Odds Table below we have the following relevant levels:
1734, 100% odds – Stop Loss level.
1798, 67.93% odds - First valid level to go LONG for the next trading session.
As predicted, the ES had a negative Close on Monday.
Yesterday we said that if any of the price levels indicated was reached it may have been a new occasion to BUY: 1822.50 and 1813.25 were in fact pierced (low of the day was 1809.50), if you did buy 1813.25 you would be slightly profitable already overnight, but we agree the odds weren’t that good.
Let’s see if the market can reach 1798 (or lower) today, the odds there are 67.93%, you can become a little bit more aggressive on this level if you want. Our forecast is that if 1773.50 is reached, you can probably go LONG safely with a big bet, but it has to be seen if that level can be reached at all.
The ES LONG Odds Comparator below show us what the odds would be if the sub-1800 price area would be reached:
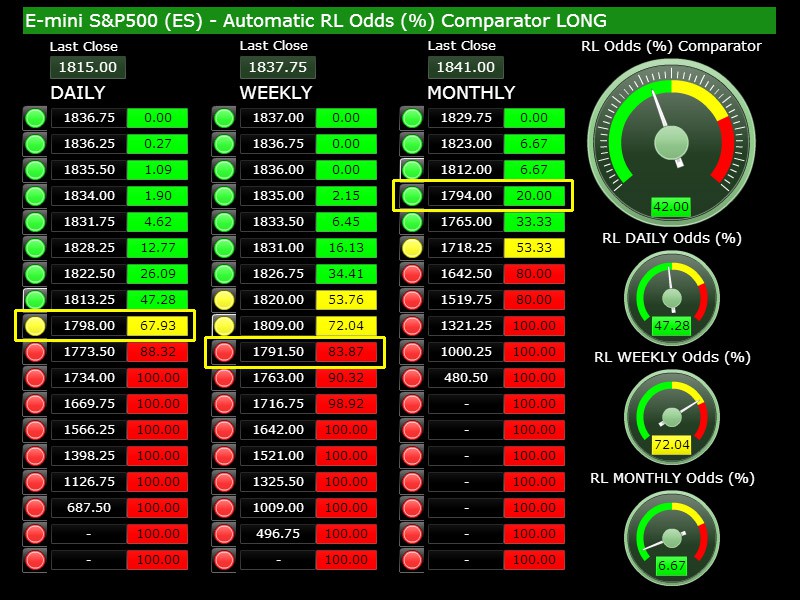
DAILY 67.93% Odds
WEEKLY 83.87% Odds
MONTHLY 20.00 % Odds
OVERALL 42.00 % Odds
The odds still aren’t particularly good for the long-term trend, if we look at the above, although the Weekly odds at 83.87% should make us think: probably an intermediate 1-week bounce is possible, if this weeks closes down after touching the 1791.50 level intraweek.
TO GO SHORT ANALYSIS
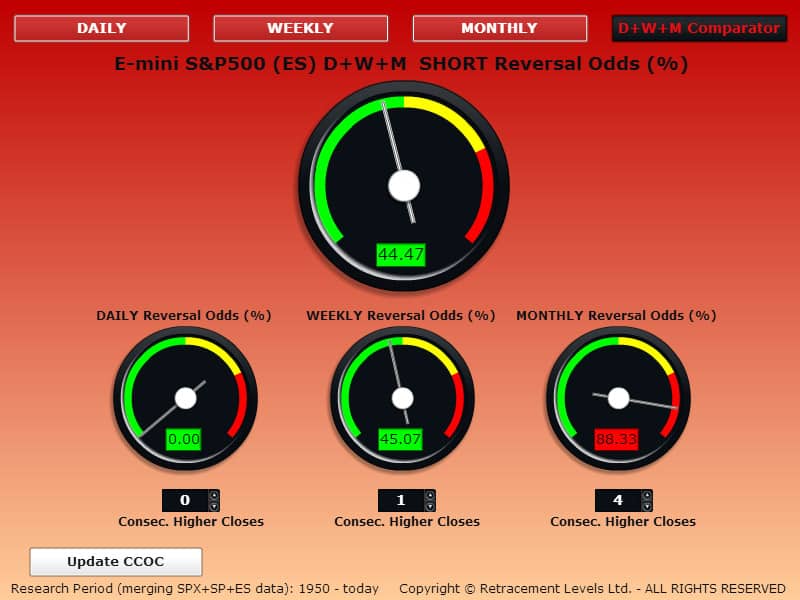
The CCOC DAILY gauge below is showing 0% odds to GO SHORT. In other words, the best time to go SHORT has passed, it was last Friday. If you go SHORT now, you risk to enter too late.
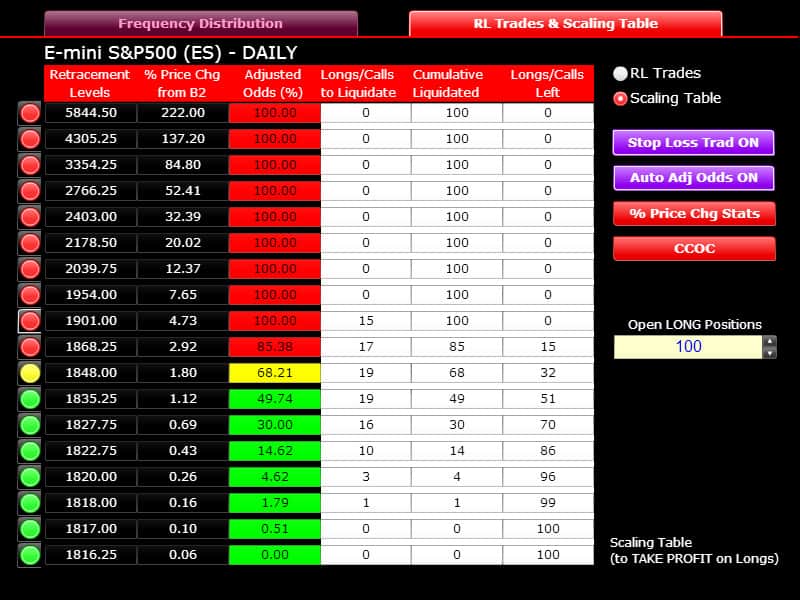
On the SHORT Odds Table below we have the following relevant levels:
1901, 100% odds – Stop Loss level.
1827.75, 30% odds – First valid level to go SHORT for the next trading session. This level will work if the index is now in a downtrend (short-the-rally strategy).
1835.25, 49.74% odds – First “safe” level to go SHORT. What is a bit concerning with the ES reaching again this level is that it would show a strong will to recover from yesterday’s dive, however the odds are good, you can try it and place a Stop Loss not too far above it.
The ES SHORT Odds Comparator below show us what the odds would be if the price area near 1835 would be reached:
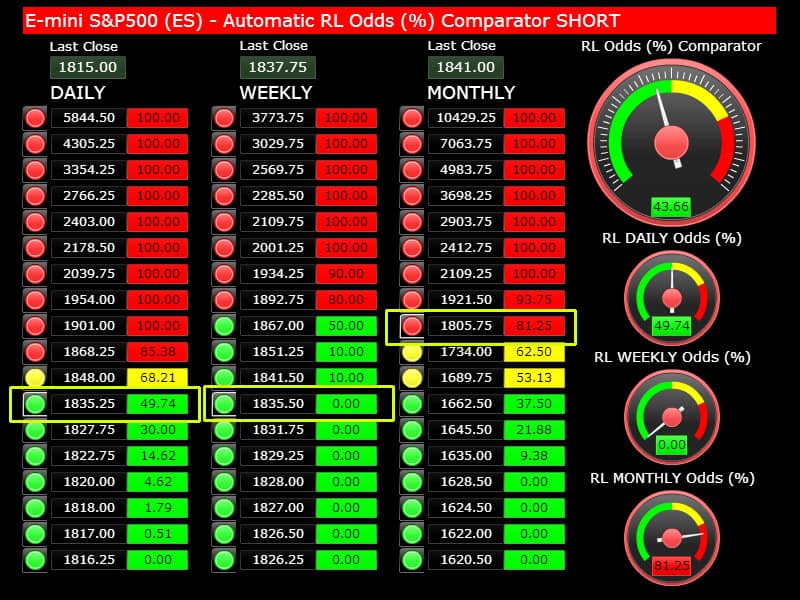
DAILY 49.74% Odds
WEEKLY 0% Odds
MONTHLY >81.25% Odds
OVERALL 43.66% Odds
As the market entered a (for now) small correction, the odds to go SHORT decrease. At the moment the MONTHLY is closing negative (December’s Close was at 1841), so even that SHORT trade is actually no more valid, which means the market is de facto in a correction, with a good chance to end this month of January down. If that happens, there is a chance that buyers step in, attracted by the lower prices and from there the market may go higher again, so we would not hope to get much more than a month down. If you look at the LONG Odds Comparator below you will see that if the market gets closer to the 1765-1718 MONTHLY price levels (LONG), the odds become good, between 33 and 53%, so you can write down these numbers because there is probably the limit for this correction (the end of the downtrend, IF ANY).
Copyright © 2014 Retracement Levels. All Rights Reserved
Comments
No comments yet.

