Users: Funatwork: ES Quantitative Analysis | Slope of Hope
ES Quantitative Analysis | Slope of Hope
Hi to everyone, this is something new on Slope of Hope (unless you have been following this blog since inception…).
Retracement Levels Ltd. publishes Quantitative Market Analysis like this for the SPX index since 2008, roughly 1600 daily articles have been published so far, on a daily basis. What we do is to analyze the market trend for selected indexes, using exclusively our proprietary quantitative measurements. Our analysis is called “Quantitative Analysis”, and it is different in name and substance from “Technical Analysis”.
It may take you a while to adapt to the different way of looking at the market that we propose, but if you are interested, here below is a market analysis specific for the E-mini S&P500 (ES), it is valid for today’s trading session (more precisely it is valid from the moment the ES Futures market re-opened, yesterday evening and all through Wednesday until the Close).
We hope you will enjoy it.
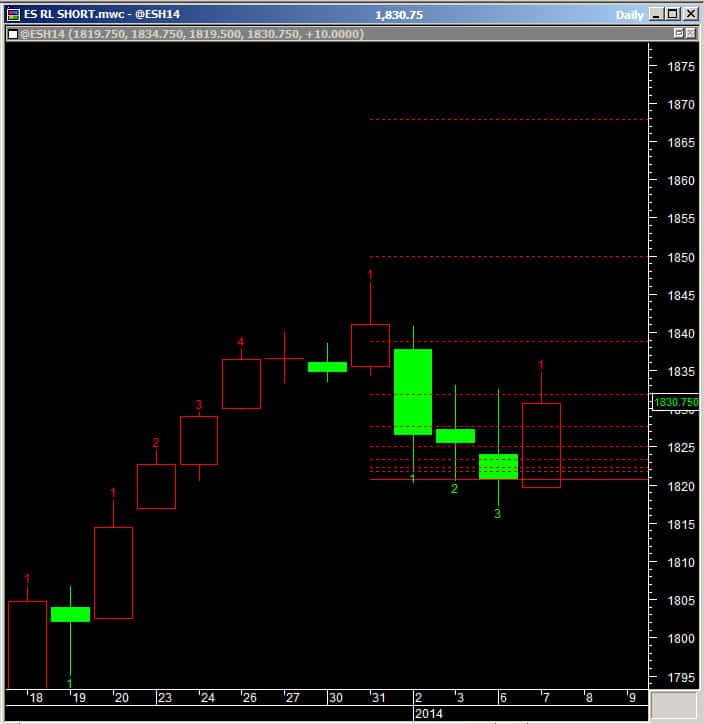
First of all, to help the transition from Technical Analysis to Quantitative Analysis, let’s start from a chart – this is a chart that shows you our proprietary retracement levels TO GO LONG (to execute LONG trades) traced in green color:
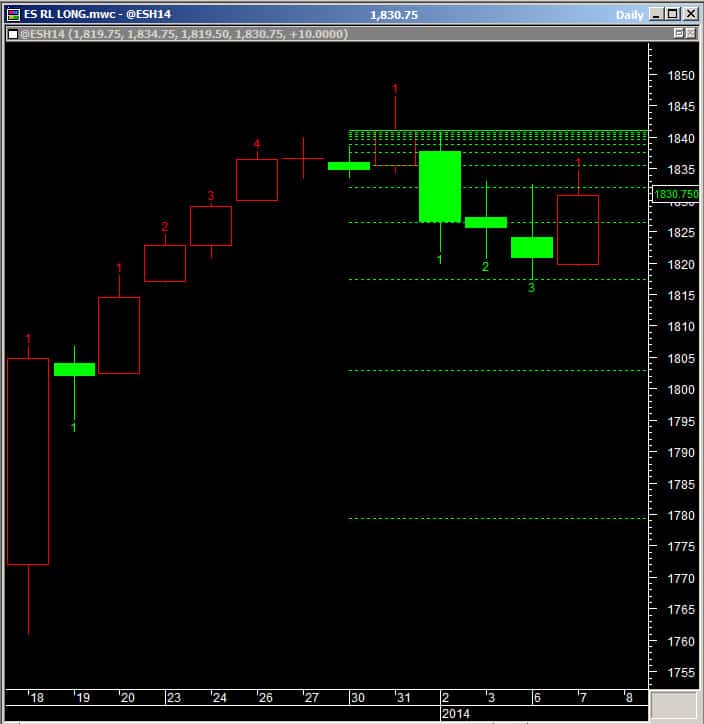
The red candle on the chart tells us that the ES yesterday closed up at 1830.75, after 3 days down.
You probably noticed that there are a series of small numbers under the 3 green candles: 1,2,3. These numbers represent the number of Consecutive Closes Down, or in other words the number of days the ES consecutively closed down, before closing up again one day (red candle).
These numbers refer to our TIME Quantitative Analysis: we basically count the number of consecutive closes in one direction and then put them in an historical statistical context, so that we know what happens, on average, after 3 days down in a row (=the market usually bounces).
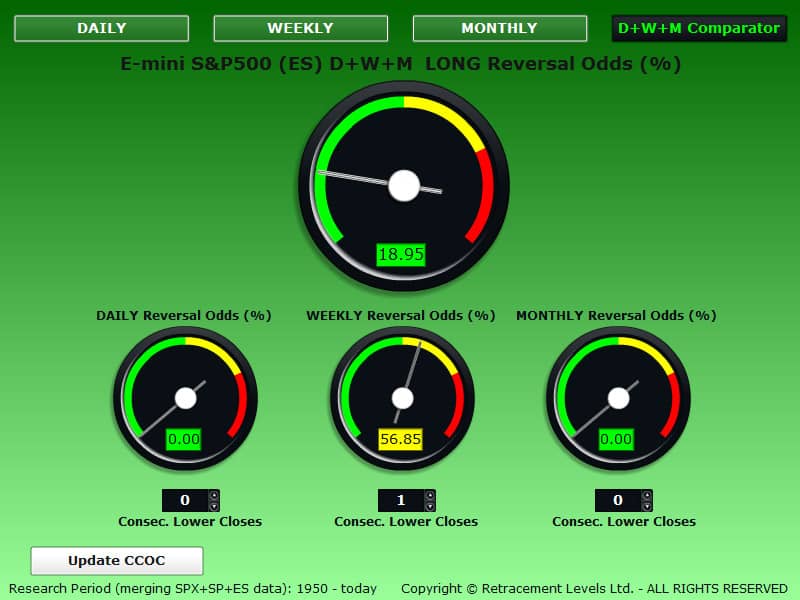
Here below you can see one of our quantitative analysis tools counting the number of current consecutive negative closes for the ES, on Daily, Weekly and Monthly time periods and a probability of trend reversal (Odds %) associated with it. As you can see the Daily time period has 0% odds to reverse the trend from SHORT to LONG after yesterday’s Close, because the ES yesterday closed UP and so the trend has already reversed LONG. The Weekly time period instead, at the Close last Friday was showing 1 week down and 56.85% odds to go LONG. These were good odds for a LONG trend reversal and it means the market has a good chance to close the current week UP.
So, the first observation that we like to make here is that from a TIME perspective, on the DAILY TIME PERIOD, the ES was OVERSOLD at the Monday’s Close: it did close down 3 days in a row, and a bounce was very likely on Tuesday (and that is in fact what happened). This shows you how we use our TIME Analysis to predict trend changes, now let’s have a look at the PRICE Analysis.
Let’s pull up again the TO GO LONG chart above:
Let’s focus on the green retracement levels: please note these are NOT Fibonacci levels, they are actually proprietary retracement levels calculated with our proprietary formulas. Their role is to help us perform a PRICE Quantitative Analysis to predict price trend reversals. Here is where things will get a little bit more complicated, but nonetheless interesting, I promise.
We will try to give you a quick glimpse of how exactly our methodology works: you can see that on the third green down candle the Low of the day kissed the green retracement level to the penny. So far nothing special because it happens many times that a price touches exactly a trendline, a Fibo fans, or whatever other graphic overlay you put on a chart.
However, what is special is that we offer a probabilistic prediction of having a trend reversal at that specific retracement level, as follows:
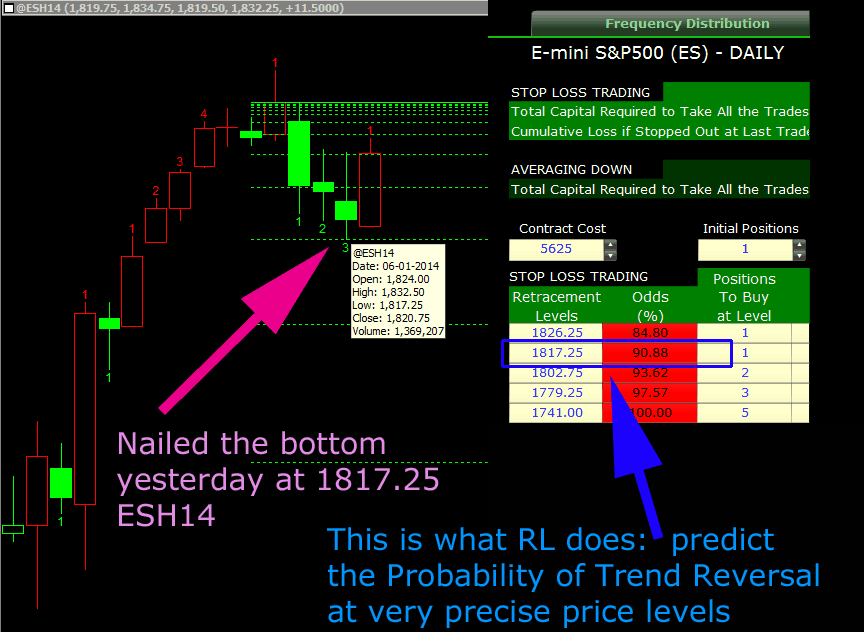
So, basically we publish market tables based on our proprietary quantitative analysis of the market, to assess the probability of trend reversal at specific price levels.
For example, if you want to go LONG the ES, you will use this table below to assess what are the best levels to go LONG at the moment, based on statistical probability:
The levels you see represented in the table above are the same seen in the TO GO LONG chart.
Interpretation of the numbers is hard, and here is where we intervene to make sense of it, guiding you through the maze of price levels showing up in the markets every day.
Basically we will read the table above and tell you what to do.
Set your Stop Loss at 1732 (100% odds of LONG reversal, if the market has not reversed LONG by the time it reaches this level… something is wrong, we may be in a crash so you must get out).
You can take your first LONG trade at 1816.25, with 38.58% odds. If you enter a trade LONG before this level is reached… you are taking a risk, a gamble – this does not mean that the market cannot go higher for example from the 1825.25 level, but we use our quantitative analysis to highlight the safest trade zones, and 1825.25 is not safe, it is a gambling area. If you like gambling and you know what you are doing, then take the trade at 1825.25 or at any earlier level.
1807 is particularly attractive because the odds are good: 56.97% odds, and so are the levels lower than this. If you buy at these levels a bounce is very likely. Please consider that we are looking for volatility/trend reversals trades, we are not trying to ride long term trends. Obviously this statement opens a Pandora’s box on what are the best trading techniques but you already know that each method has his pros and cons and we believe that long term trend-following is a non-predictable investing environment while short-term trend reversals are predictable to a certain degree (and thus safer). We do not pretend to convince you, but this is our creed.
Now, to conclude our analysis of the LONG side, we will show you a tool that compares the probability of LONG trend reversal on 3 time periods: Daily, Weekly and Monthly, we call it the RL Odds Comparator:
What the tool above does is to show you when the market is OVERSOLD at the same time on 3 specific time periods: Daily, Weekly and Monthly. If the odds are good on ALL the 3 time periods, then you have a very strong LONG setup.
The 3 small gauges on the right will show you what the odds to go LONG are for each time period for the current price area (plus the big gauge will show an average of the 3 small ones).
So, at the moment, we can see that we have the following odds @ levels:
DAILY 1816.25 – 38.58%
WEEKLY 1813.25 – 17.95%
MONTHLY 1812 – 6.67%
The 3 price levels are not exactly the same but they highlight a trading zone between 1816 and 1812. What the above tool tells us is that on the DAILY time period, a bounce is likely from 1816.25 (if this level is reached) because the odds are kind of good (although <50%), however the WEEKLY and MONTHLY odds in this price area are telling us that we are far from having good odds for long-term trend reversals lasting at least one week or one month.
What does this mean for your trading/investing activity? Very simple: do not place a big bet LONG at these price levels because the odds are not so good and the market may tank much lower (if it tanks at all, of course).
Now, let’s have a look to the TO GO SHORT strategy for today, using the same tools. First we start with the chart with the TO GO SHORT levels:
Let’s analyze first the TIME perspective.
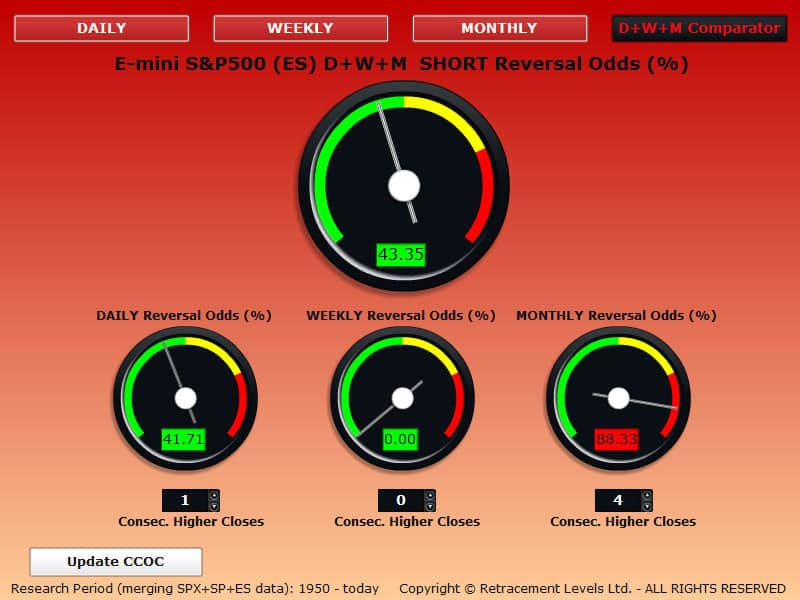
The CCOC table above tells us that the ES has closed up 1 day and the odds for a trend reversal, DAILY, are 41.71%. The MONTHLY time period however tells us another story: 4 months closing up in a row and 88.33% odds to have a SHORT trend reversal. This means that from a TIME perspective a long-term trend reversal (a downtrend) is possible from here.
Let’s see now what are the odds for the various PRICE levels:
Set your Stop Loss at 1897.25 (100% odds of LONG reversal, if the market has not reversed SHORT by the time it reaches this level something is wrong, the Bulls are pushing the market to the stars, so you must exit this SHORT trade).
You can take your first SHORT trade at 1832.00, with 57.79% odds. These are good odds for a SHORT trade, there is a high chance (not certainty, but high probability) to see a trend reversal from here.
If the market reverses from 1832, it means the uptrend we have seen on Tuesday is at risk, or in other words we may be in a short-term downtrend.
Let’s have a look to the RL Odds Comparator SHORT:
At the moment we can see that we have the following odds @ levels:
DAILY 1832.00 – 57.79%
WEEKLY 1831.75 – 0.00%
MONTHLY 1805.75 – 81.25%
The analysis of the above tool says that the DAILY odds at 1832 are good enough to try a SHORT trade, even though the WEEKLY time period in the same price area (1831.75) is not supporting the trade, the odds are only 0%. This happens because the last Weekly Close was down and so the tool calculates the odds to reverse =0% (this is a mathematical thing: since the SHORT reversal has already started, the odds for it to happen at the moment are 0%).
The MONTHLY time period is showing very good odds and this matches what we have seen on the TIME analysis in the CCOC SHORT (Consecutive Closes Calculator): this means the market is long-term OVERBOUGHT.
What does this means for your trading/investing activity? Well, it means that if we were in you we would not bet too much on a continuation of the current uptrend from here, our quantitative analysis shows that the market is already quite over-extended both in TIME and PRICE and a one month correction is a possibility, at any time from this moment.
Does this mean a Bear Market is about to start? Well, this is hard to predict, you should probably ask Robert Prechter as he seems to be particularly good with long-term bearish predictions.
In our view, the market will continue to run higher in 2014, at least into March/June, where a seasonal correction is possible.
In the very short term, if we really had to go LONG, we would prefer to wait for the ES market to reach price levels where the LONG odds are good.
If you want to go SHORT, this seems a good moment for a lasting trend reversal, meaning that the correction may last one or more weeks, but we cannot time precisely the moment it will start, it’s a matter of probability, you have to try your luck when the odds are good, when the DAILY, WEEKLY and MONTHLY combine themselves together offering a high chance of success (chances are quite good now on DAILY and MONTHLY time periods).
If you are willing to follow us on SOH in the next few days, we will try to keep you posted on the next market developments, always using exclusively our proprietary Quantitative Analysis tools.
Copyright © 2014 Retracement Levels. All Rights Reserved
Comments
No comments yet.

