Users: Funatwork: A Sloper Helps Explain VIX | Slope of Hope#more-31868
A Sloper Helps Explain VIX | Slope of Hope#more-31868
vix and vxx
I’ve expressed enough confusion about the VIX to draw some attention from good-hearted folks who, unlike me, know a lot about the subject. One fellow in particular, whom has chosen to remain anonymous to readers, was good enough to compose the explanation beneath, complete with charts from his Bloomberg terminal; thank you!
I’ll do my best to explain VXX and VIX options. I know for a fact that it won’t be as clear or concise as I’d like but if it really is unintelligible, please let me know and I’ll do my best to elaborate.
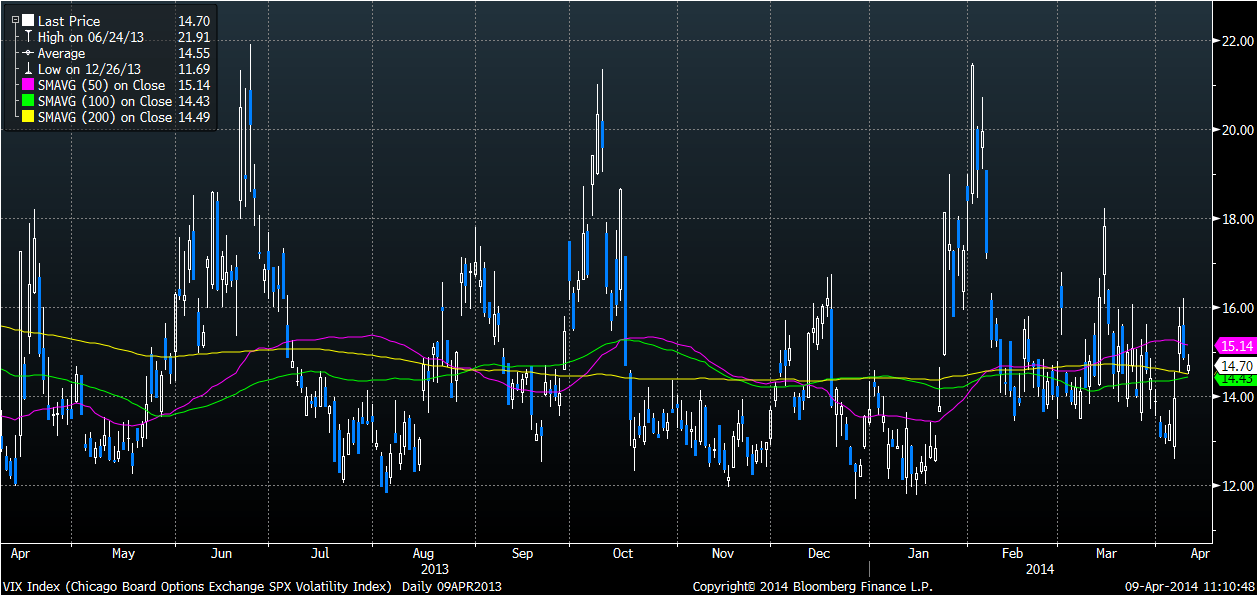
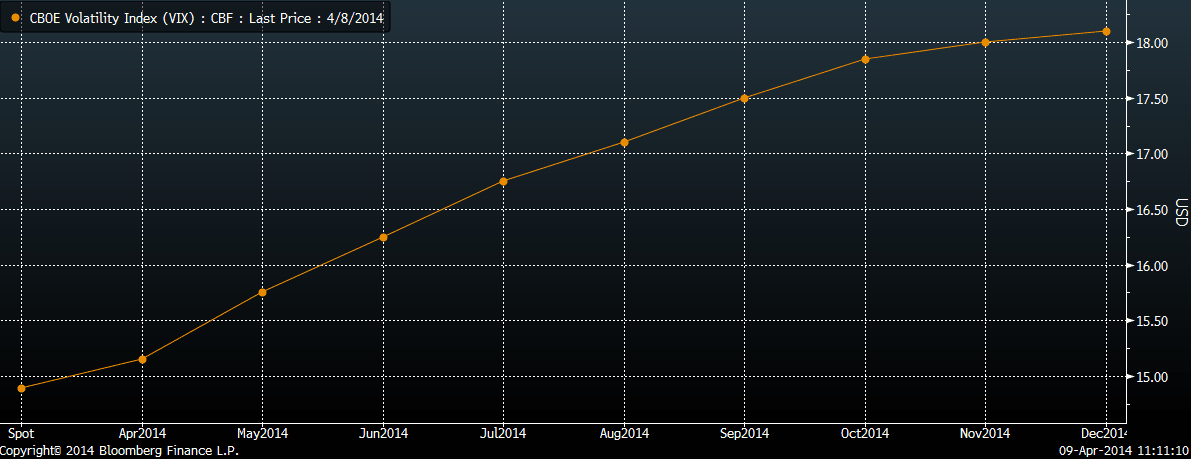
Ok, for starters, VXX is an ETN which tracks the VIX futures (first and second contract – in this case Apr & May) as opposed to the cash index which is the VIX index that is commonly referenced in the media. As you can see from the chart of the term structure below, the VIX futures trade at a premium to the cash VIX and while correlated, the futures do not necessarily track movements in cash index. So if the cash index goes up, the futures will likely go up as well but there’s no guarantee that the increase will even remotely resemble that of the cash index.
The vast majority of times VXX underperforms the cash index though in some circumstances it does outperform. There is only one way to gain exposure to the cash index and that is through VIX options, and even then, the exposure is not ideal (more on this later).
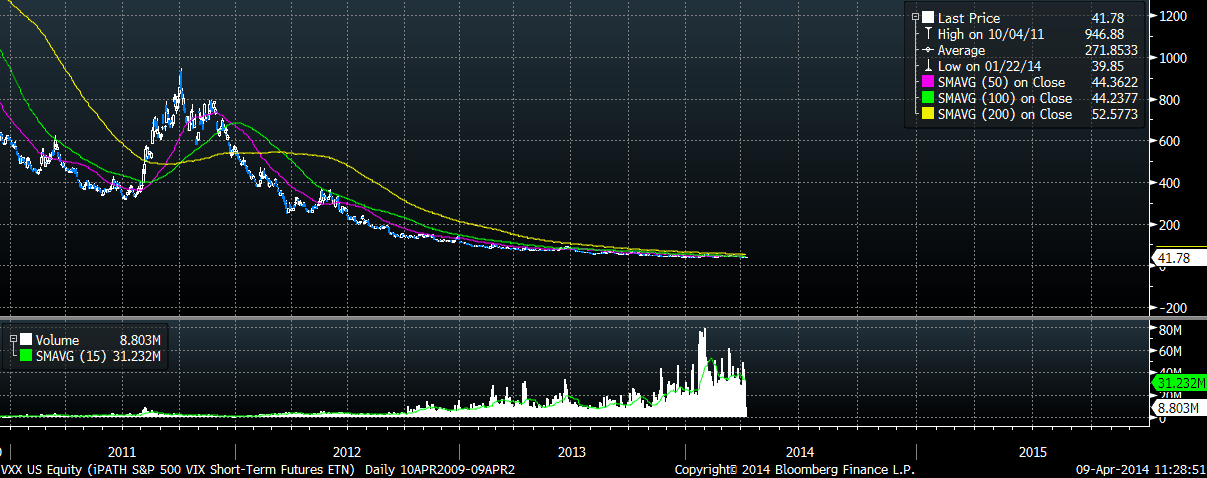
Most people know from just looking at a chart of VXX that it is a poor investment as it almost continually trends down. The reason for this however is not as well understood (even by very large institutional investors). Basically, it lies in the composition of the ETN and the term structure of VIX futures.
Basically, at the beginning of the month VXX is composed of 100% of the front month VIX futures contract so theoretically on April 1st, VXX will be long only April 2014 VIX futures. At the end of the first trading day, 1/20th of that position in April futures will be sold and May futures will be purchased with the proceeds (this is known as a roll). This process is repeated every day until the entire position in April futures is sold at the end of the month and ETN now only holds May 2014 contracts. The same process is then repeated with the next contract (Sell May, Buy June) and then the next, theoretically in perpetuity.
However, as you can see from the term structure below, the front month contract trades at a discount to the 2nd contract (this isn’t always the case but it does tend to hold true for the vast majority of the time). So VXX is essentially selling the front month contract for less and buy the next contract for more every day, creating a negative roll (a roll which basically costs the ETN money) which erodes the value of the entire security each day.
So assuming the term structure doesn’t change (which isn’t entirely accurate but will serve for this example), VXX loses 19 bps of value each day [1/20 * (back month price – front month price)/ front month price] or 3.96% per month. So even if volatility remains unchanged, VXX should decrease by approximately 4% per month, every month, creating the insufferable downtrend you see in the chart below. That’s why holding VXX over any extended period of time is a losing bet. The odds are stacked against you, in that the VIX itself hasn’t been in an uptrend since 2012 and you basically have to pay just to sit in the trade. So, not surprisingly, VXX is traded mainly by day traders and guys looking to short volatility (and earn 4% per month!).
Well, hopefully that will be less painful to read than it was to write. It was so painful that I’m going to write about VIX options later just to give myself a break from this slow torture. Please let me know if anything doesn’t make sense. (Click on any of these images for a larger version).
Comments
No comments yet.

