Users: Funatwork: Four Grumpy Bears | Slope of Hope#more-32780
Four Grumpy Bears | Slope of Hope#more-32780
SHJ 5/7/14 targets SPX,DOW,NDX
Well Monday was all set up for the bears, and they blew it. Yesterday was all set up for the bulls, and they blew it too. Of the two the bulls blew it worse in my view, and I’m going to review the very nice topping setups here on all four of the main US indices that I follow.
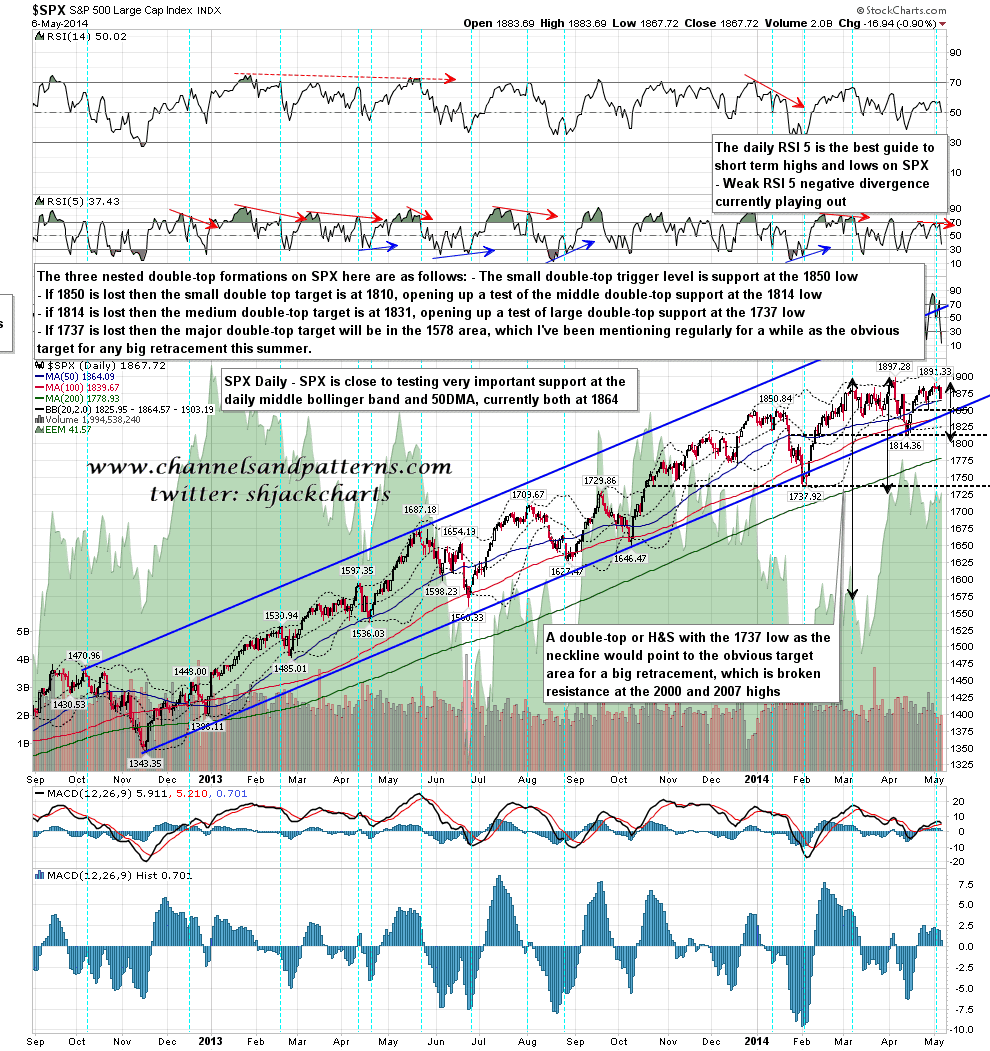
The first two are SPX and Dow, and on these two there are remarkably similar sequences of three nested double-tops with ultimate downside targets at tests of the broken 2007 highs.
On SPX the first thing to mention is very strong support at 1864, with both the daily middle band and the 50 DMA at 1864 at the close yesterday. If that should break then the first and smallest double-top support level is at the 1850 low. A break below that should be the start of a slide down this series of increasingly large double-tops down to a target in the 1578 area, effectively to retest broken resistance at the 2007 high. That might not all play out of course, but I did mention this target as possibility last summer as it is the obvious technical target for a big retracement here to set up the next big move up. SPX daily chart:
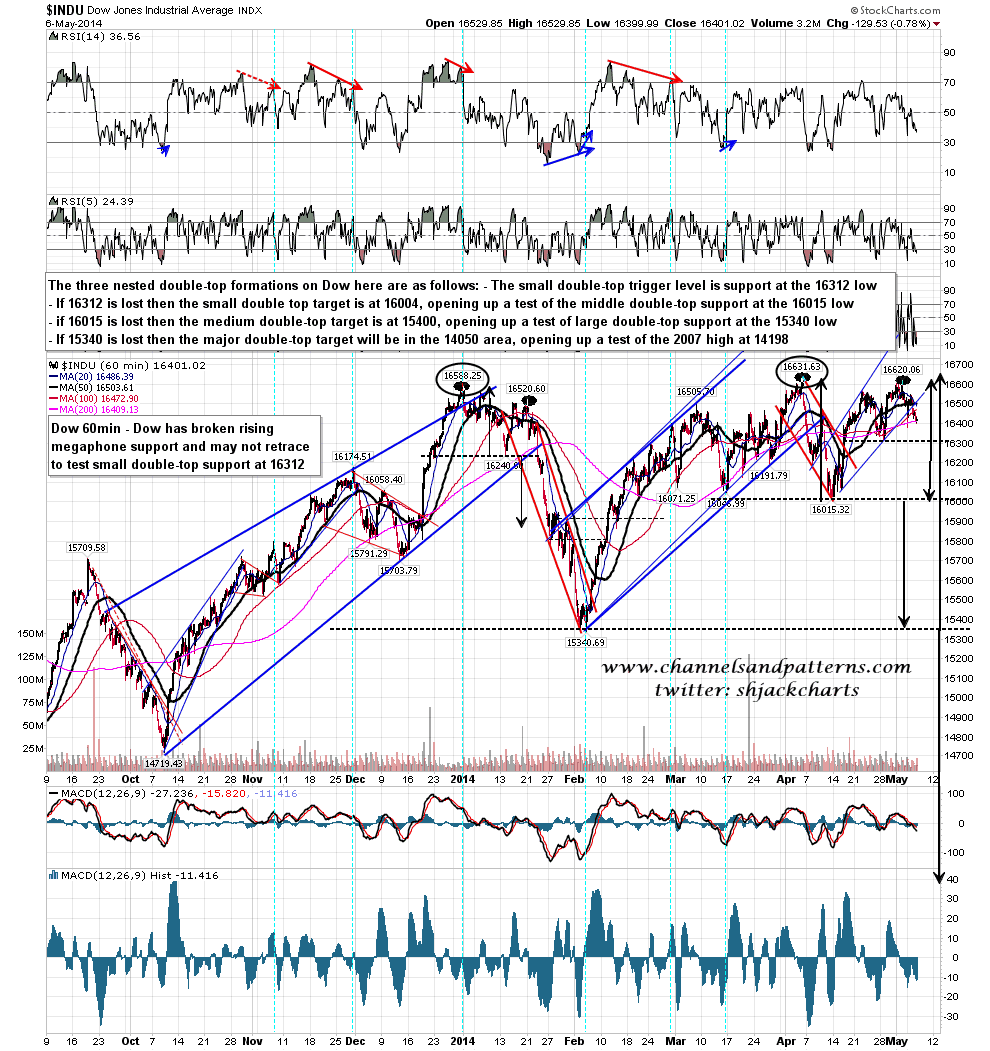
The setup is remarkably similar on Dow, where the short term broadening ascending wedge from the 16312 low has now broken down with a target back at that low, which is double-top support for the first and smallest double-top setup on Dow. A break below should be the start of a slide down this series of increasingly large double-tops into a target in the 14050 area, slightly under broken resistance at the 2007 high at 14198. The full sequence of levels and targets for these series on both SPX and Dow are marked on the respective charts. Dow 60min chart:
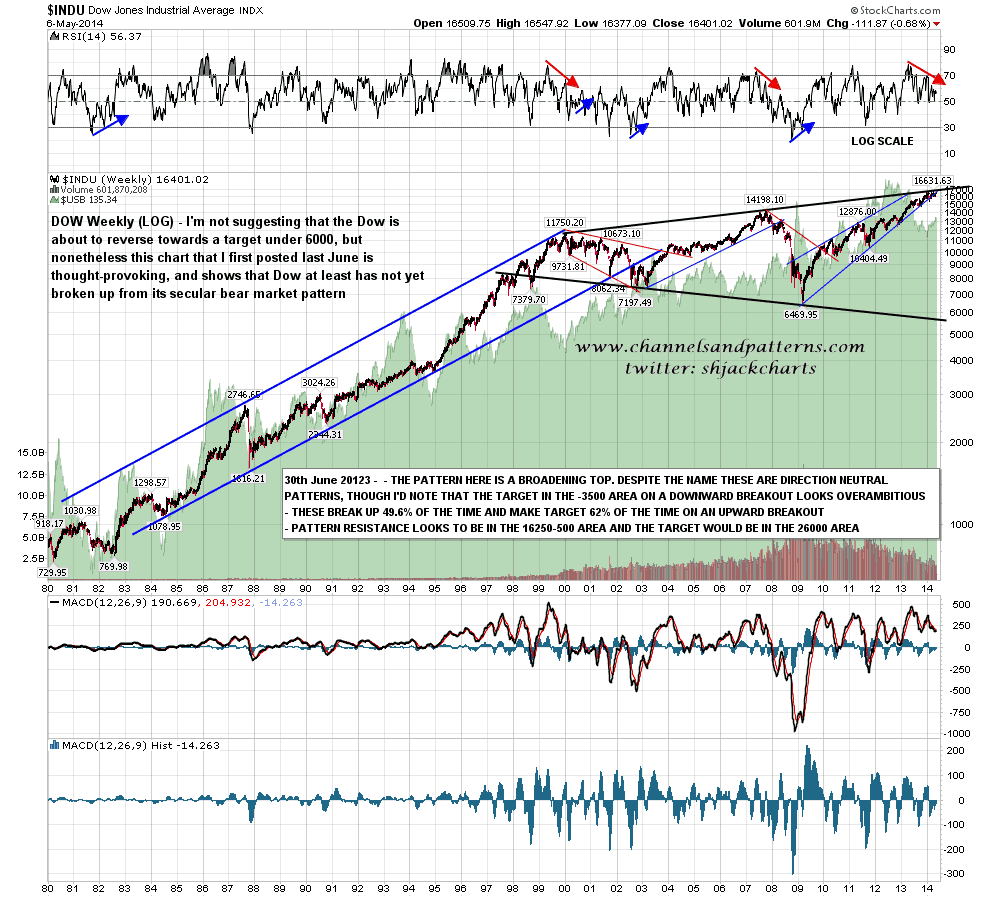
Backing up a high on Dow here is a huge megaphone on the Dow weekly (LOG) chart coming from the 1990s. This was the secular bear market patterns for Dow that I posted last June, giving an approximate target then in the 16250-500 range, just under the current all time high at 16631.63. Food for thought: Dow weekly (LOG) chart from 1980:
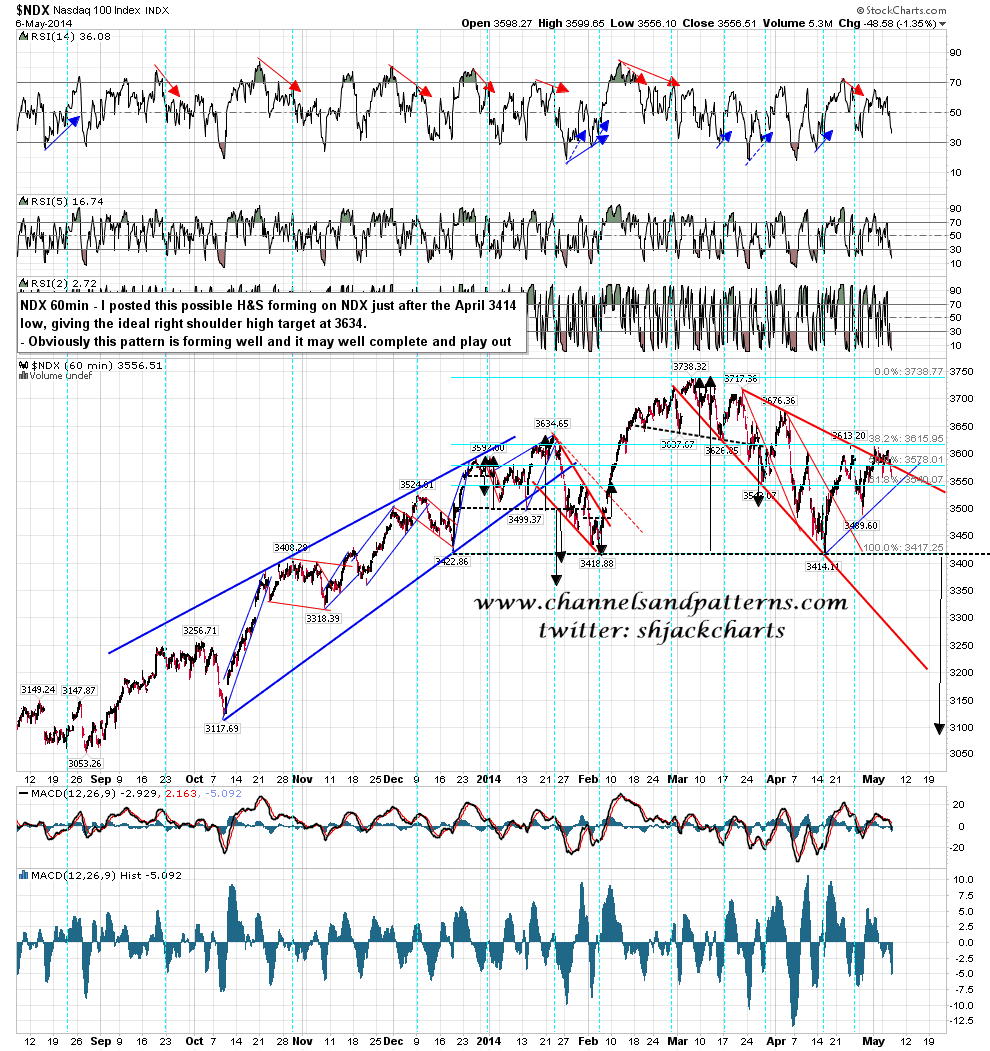
The third topping setup is on NDX, and you might recall that I posted this part-formed H&S as a possibility just after the April low at 3414. I gave an ideal right shoulder target then in the 3634 area and the current high from there is 3613, which is close enough. Obviously this is still a very nice looking H&S and if it completes and breaks down then the downside target would be in the 3090 area. NDX 60min chart:
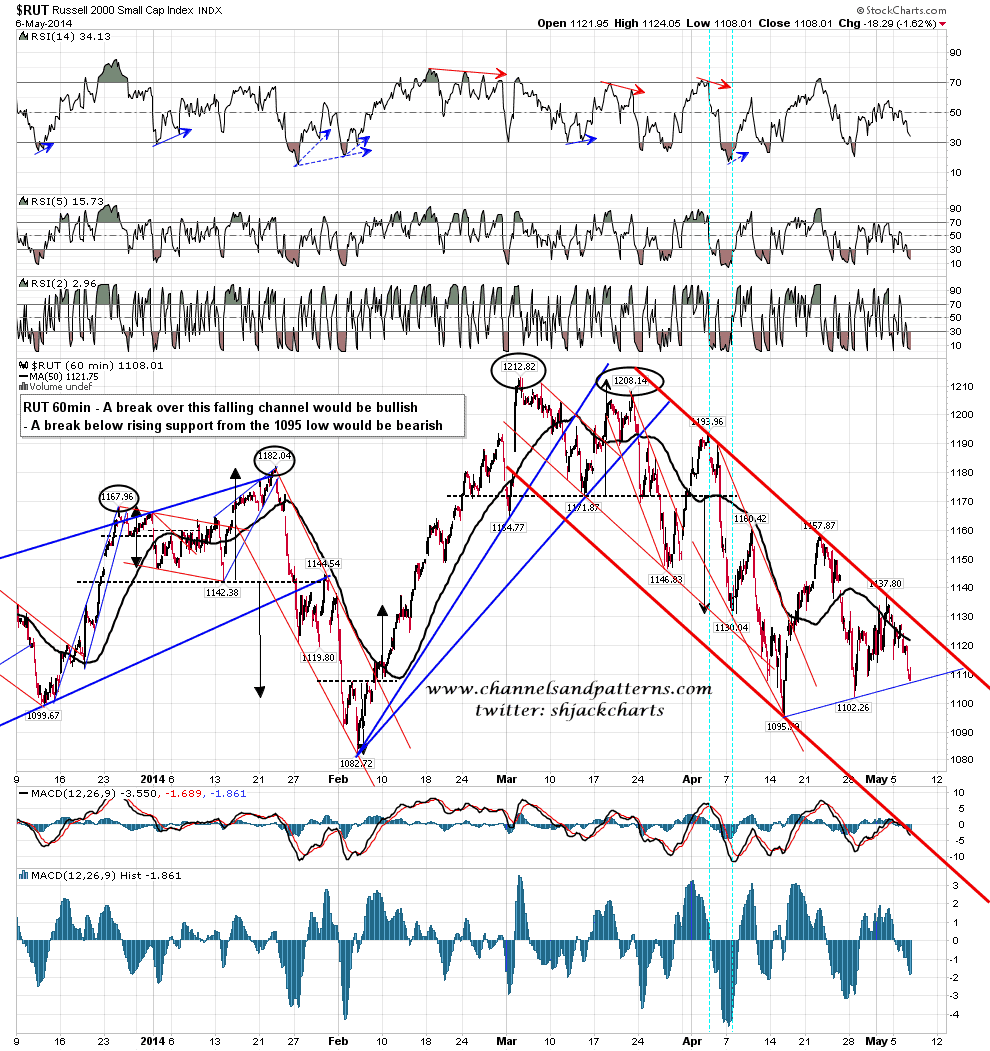
I posted the falling channel on RUT yesterday and obviously that didn’t break up. If that should break up that would obviously be bullish. The low yesterday however was at rising support within that channel from the 1095 low, and if that breaks that would open up a move to falling channel support, currently in the 1040-50 area. I haven’t marked it up, but a break under 1082 would also trigger a double-top target in the 950 area. RUT 60min chart:
The reality is that bulls have been struggling and failing repeatedly to break up from the range that equities have traded in this year. These topping setups on SPX, Dow and NDX particularly are so good that I’m planning to use them in a book I’m planning regardless of whether they play out. If bulls can’t break up, then the high is in and we are in the (relative) calm before the storm. Don’t get married to any long positions, and the bulls need to demonstrate soon that they aren’t a spent force just waiting for the summer retracement.
I didn’t get my precious metals post done yesterday, as the day developed in a way that I was not expecting. I’ve redone the charts and will have that out today without fail.
Comments
No comments yet.

